WebGL Lint
WebGL lint wraps the WebGL API and checks for many common usage errors.
For more info see the WebGL lint website.
Spector.js
Spector.js is a system that provides a UI for inspecting your WebGL usage.
It can be used as both a devtools plugin for Chrome and Firefox or as a library. As a library it’s possible to inspect your WebGL startup code. As a devtool you can generally only inspect things once your app is running. Therefore, if you’re trying to track down an issue that happens during initialization it can be better to use Spector.js as a library so that you can programmatically enable it at your program’s initialization time.
Programmatically Debugging WebGL applications
WebGL’s error reporting mechanism involves calling getError and checking for errors. As it can be burdensome to put a getError call after every WebGL function call here is small library to help with make this easier.
https://github.com/KhronosGroup/WebGLDeveloperTools
To use the library, clone the repository, put src/debug/webgl-debug.js on your server, and include it with
<script src="webgl-debug.js"></script>
Then you can wrap your WebGLRenderingContext in an object that checks all calls like this
ctx = WebGLDebugUtils.makeDebugContext(canvas.getContext("webgl"));
This will make any GL errors show up in your browser JavaScript console.
If you want to do something else, like throw an exception you can pass in your own error handling function.
function throwOnGLError(err, funcName, args) {
  throw WebGLDebugUtils.glEnumToString(err) + " was caused by call to: " + funcName;
};

gl = canvas.getContext(...);
gl = WebGLDebugUtils.makeDebugContext(gl, throwOnGLError);
Showing every WebGL function call
Download the webgl-debug library mentioned above. Then make a function to print the calls like this
function logGLCall(functionName, args) {
   console.log("gl." + functionName + "(" +
      WebGLDebugUtils.glFunctionArgsToString(functionName, args) + ")");
}

gl = canvas.getContext(...);
gl = WebGLDebugUtils.makeDebugContext(gl, undefined, logGLCall);
Checking that none of your arguments are undefined
One of the interesting choices of JavaScript is that it will try to coerce values of 1 type into another. This can make it hard to find bugs. For example if you do something like this
   var textureInfo = {
     tex: gl.createTexture()
   }
   gl.bindTexture(gl.TEXTURE_2D, textureInfo.tx);
Notice the typo? It’s ‘tex’ at the top but ‘tx’ at the bottom. ‘tx’ is undefined but the rules of JavaScript require that to be silently coerced into NULL which is a valid argument.
You can check for errors like this by adding a function that checks for undefined on all arguments passed to WebGL.
function validateNoneOfTheArgsAreUndefined(functionName, args) {
  for (var ii = 0; ii < args.length; ++ii) {
    if (args[ii] === undefined) {
      console.error("undefined passed to gl." + functionName + "(" +
                     WebGLDebugUtils.glFunctionArgsToString(functionName, args) + ")");
    }
  }
}

gl = canvas.getContext(...);
gl = WebGLDebugUtils.makeDebugContext(
    gl, undefined, validateNoneOfTheArgsAreUndefined);
Combine all 3 techniques above
function logAndValidate(functionName, args) {
   logGLCall(functionName, args);
   validateNoneOfTheArgsAreUndefined (functionName, args);
}

gl = canvas.getContext(...);
gl = WebGLDebugUtils.makeDebugContext(gl, throwOnGLError, logAndValidate);
See a sample of the above techniques
https://github.com/KhronosGroup/WebGLDeveloperTools/blob/master/src/debug/debug-sample.html
Printing Errors and other constants
WebGL uses many constants and returns errors as numbers. It’s often easier to display those numbers as strings. With that in mind you can call WebGLDebugUtils.glEnumToString to convert a WebGL constant to a string.
Example:
WebGLDebugUtils.init(ctx);
alert(WebGLDebugUtils.glEnumToString(ctx.getError()));
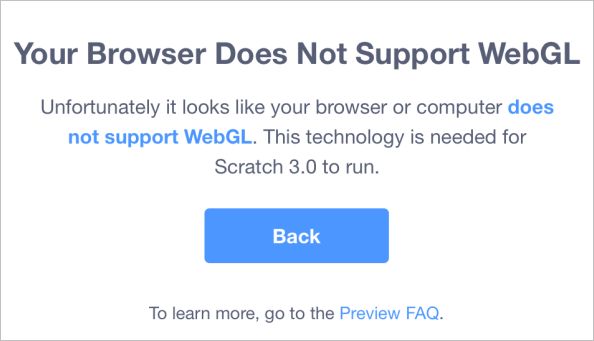
Доступ к сайтам, использующих технологию WebGL, может быть затруднен из-за сообщения об ошибке «Your browser does not support WebGL». С этой проблемой можно столкнуться при посещении сайтов WebGL Earth, Shadertoy и прочих. Ошибка чаще встречается в Google Chrome и возникает на конфигурациях ПК, использующих устаревшую модель графического процессора.
WebGL – это JavaScript API, который используется для рендеринга 2D и 3D графики без применения плагинов в любом совместимом браузере. Несмотря на то, что технология полностью интегрирована с большинством веб-стандартов, она еще зависит от поддержки графического процессора и недоступна на устаревших моделях.
Содержание
- 1 Причины ошибки
- 2 Поддерживает ли браузер WebGL?
- 3 Включение аппаратного ускорения
- 3.1 Google Chrome
- 3.2 Mozilla Firefox
- 3.3 Opera
- 4 Обновление драйвера видеокарты
Причины ошибки
Если при попытке доступа к сайту видите ошибку «WebGL не поддерживается», то причины ее возникновения могут быть следующими:
- Используется устаревшая версия браузера, в котором отсутствует поддержка WebGL.
- Отключено аппаратное ускорение в браузере.
- В системе установлены устаревшие драйвера видеокарты.
- Установлена Windows XP, которая не поддерживает технологию WebGL.
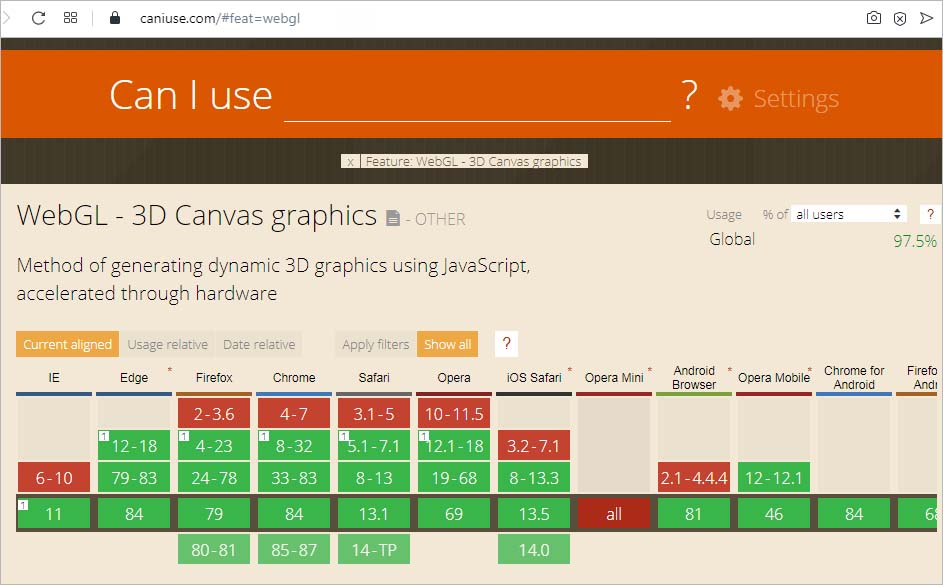
Имейте в виду, не все версии браузеров поддерживают WebGL. Если версия сильно устарела, увидите сообщение об ошибке. Поддержка практически присутствует во всех последних версия браузеров, но есть исключения. Например, технология не поддерживается в Opera Mini независимо от используемой версии.
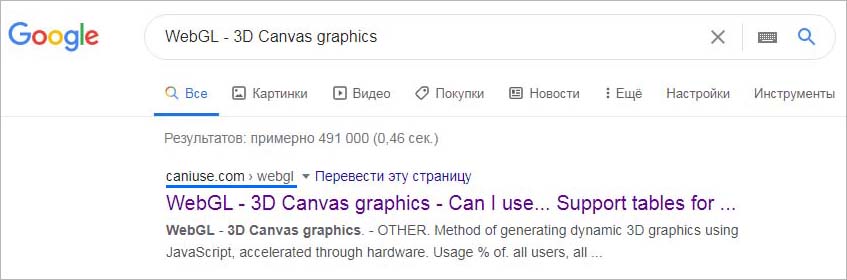
Быстрый способ проверить, поддерживает ли браузер эту технологию, можно на указанной странице, которую можно найти в интернете по запросу «WebGL — 3D Canvas graphics».
Включение аппаратного ускорения
Самой распространенной причиной, которая вызывает ошибку «WebGL не поддерживается», является отключенное аппаратное ускорение в браузере. Правильная работа технологии зависит от аппаратного ускорения, поэтому нужно проверить, включена ли эта функция.
Google Chrome
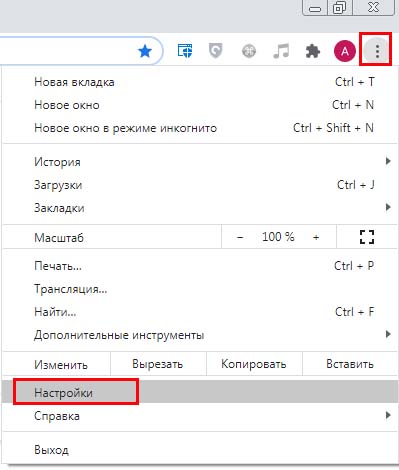
Откройте основное меню нажатием на значок с тремя точками и выберите пункт Настройки.
Прокрутите страницу вниз и щелкните на кнопку «Дополнительные». Найдите раздел Система и проверьте включена ли опция, связанная с использованием аппаратного ускорения.

В противном случае включите ее и нажмите кнопку «Перезапустить», чтобы принудительно применить изменения.
Mozilla Firefox
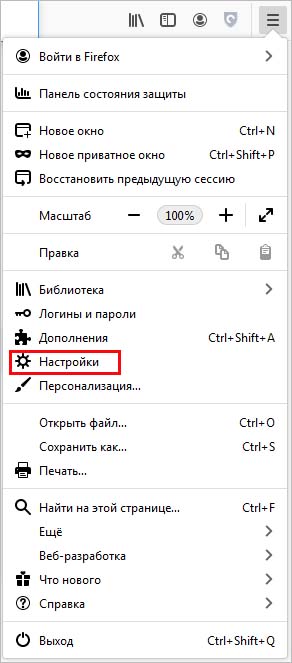
Раскройте меню нажатием на значок с тремя линиями в правом верхнем углу и выберите «Настройки».
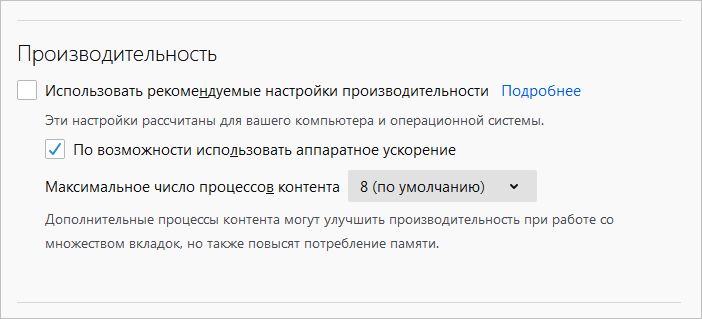
Найдите в списке раздел Производительность и снимите флажок, связанный с использованием рекомендуемых параметров. Отобразится опция «По возможности использовать аппаратное ускорение». Отметьте ее флажком и перезагрузите браузер, чтобы изменения вступили в силу.
Opera
Нажмите на значок Opera в левом верхнем углу и перейдите в Настройки. Прокрутите список опций вниз и щелкните на кнопку «Дополнительно».
В разделе Система переметите переключатель, связанный с аппаратным ускорением, в положение «Включено».
Если после включения функции WebGL все еще не поддерживается, перейдите к следующему методу.
Обновление драйвера видеокарты
Поскольку эта технология зависит от поддержки графического процессора, устаревшие драйверы также могут вызвать ошибку «WebGL не поддерживается». Для их обновления выполните следующие шаги.
Откройте Диспетчер устройств командой devmgmt.msc из окна Win + R.

Разверните вкладку Видеоадаптеры, щелкните правой кнопкой мыши на видеокарте и выберите пункт «Обновить». Если в системе установлены две видеокарты (встроенная и дискретная), обновите оба устройства.
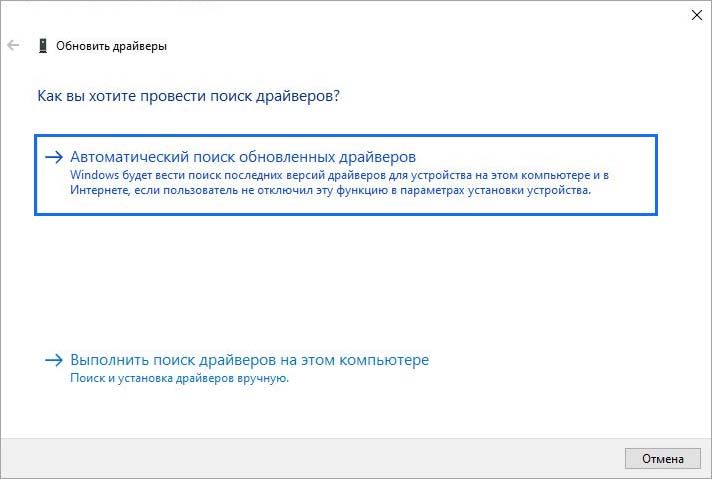
Теперь проверьте подключение к интернету и выполните автоматический поиск обновленного программного обеспечения. Если новый драйвер будет обнаружен, дождитесь завершения его установки.
После перезагрузите компьютер и попробуйте открыть сайт, который не удавалось из-за отсутствия поддержки WebGL.
Если не удалось обновить драйвер видеокарты в автоматическом режиме, попробуйте это сделать вручную. Для этого откройте сайт NVIDIA, AMD или Intel, в зависимости от производителя установленной видеокарты и загрузите последнюю версию программного обеспечения.
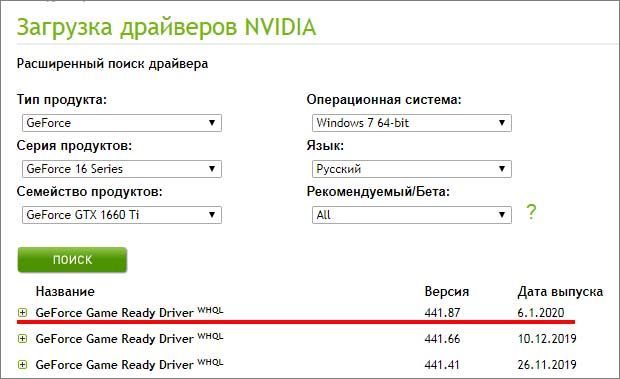
Запустите загруженный файл и следуйте инструкциям на экране до завершения установки драйверов. После перезагрузите ПК и проверьте, блокируется ли доступ к сайту ошибкой.
WebGL performance considerations
Cursor locking and full-screen mode in WebGL
Visual Studio doesn’t support debugging Unity WebGLA JavaScript API that renders 2D and 3D graphics in a web browser. The Unity WebGL build option allows Unity to publish content as JavaScript programs which use HTML5 technologies and the WebGL rendering API to run Unity content in a web browser. More info
See in Glossary content. Use the following tips to get your build information.
The browser’s JavaScript console
Unity WebGL doesn’t have access to your file system, so it doesn’t write a log file like other platforms. However, it does write all logging information such as Debug.Log, Console.WriteLine or Unity’s internal logging to the browser’s JavaScript console.
To open the JavaScript console:
- In Firefox, press Ctrl-Shift-K on Windows or Command-Option-K on a Mac.
- In Chrome, press Ctrl-Shift-J on Windows or Command-Option-J on a Mac.
- In Safari, go to Preferences > Advanced > Develop, and press Command-Option-C.
- In Microsoft Edge or Internet Explorer, press F12.
Development builds
For debugging purposes, you might want to make a development build in Unity (open the Build Settings window and enabled the Development BuildA development build includes debug symbols and enables the Profiler. More info
See in Glossary checkbox). Development builds allow you to connect the profilerA window that helps you to optimize your game. It shows how much time is spent in the various areas of your game. For example, it can report the percentage of time spent rendering, animating, or in your game logic. More info
See in Glossary, and Unity doesn’t minify them, so the emitted JavaScript code still contains human-readable (though C++-mangled) function names.
The browser uses these to display stack traces if you run into a browser error, when using Debug.LogError, or when an exception occurs and exception support is disabled. Unlike the managed stack traces that can occur when you have full exception support (see below), these stack traces have mangled names, and contain not only managed code, but also the internal UnityEngine code.
Exception support
WebGL has different levels of exception support (see documentation on Building for WebGL). By default, Unity WebGL only supports explicitly thrown exceptions. You can enable Full exception support, which emits additional checks in the IL2CPP-generated code, to catch access to null references and out-of-bounds array elements in your managed code. These additional checks significantly impact performance and increase code size and load times, so you should only use it for debugging.
Full exception support also emits function names to generate stack traces for your managed code. For this reason, stack traces appear in the console for uncaught exceptions and for Debug.Log statements. Use System.Environment.Stacktrace to get a stack trace string.
Troubleshooting
Problem: The build runs out of memory
This is a common problem, especially on 32-bit browsers. For more information on WebGL memory issues and how to fix them, see documentation on Memory in WebGL.
Problem: Files saved to Application.persistentDataPath don’t persist
Unity WebGL stores all files that must persist between sessions (such as PlayerPrefs or files saved in persistentDataPath) to the browser IndexedDB. This is an asynchronous API, so you don’t know when it’s going to complete.
Call the following code to make sure Unity flushes all pending file system write operations to the IndexedDB file system from memory:
FS.syncfs(false, function (err) {
  if (err) {
    console.log("Error: syncfs failed!");
  }
 });
Error message: Incorrect header check
The browser console log usually prints this error due to incorrect server configuration. For more information on how to deploy a release build, see documentation on Deploying compressed builds.
Error message: Decompressing this format (1) isn’t supported on this platform
The browser console log prints this error when the content tries to load an AssetBundle compressed using LZMA, which Unity WebGL doesn’t support. Re-compress the AssetBundle using LZ4 compressionA method of storing data that reduces the amount of storage space it requires. See Texture Compression, Animation Compression, Audio Compression, Build Compression.
See in Glossary to solve this problem. For more information on compression for WebGL, see documentation on WebGL building, particularly the AssetBundles section.
- MonoDevelop replaced with Visual Studio from 2018.1
WebGL performance considerations
Cursor locking and full-screen mode in WebGL
Как боросться с ошибками javaScript в WebGl[РЕШЕНО]
Привет, форум. Снова сюда привели одолевающие ошибки. Надоела одна, которая вылазеет когда покидаю или перегружаю страницу. Как её побороть? Столько времени уходит на перезагрузку файла, а ещё она ссылается на код в котором 3000000 строк(пускай простят меня все святые, там чёрт ногу сломит).
Последний раз редактировалось юnity 13 мар 2018, 08:40, всего редактировалось 1 раз.
Give exact coordinates of the decision of the problems
-

юnity - UNITрон
- Сообщения: 290
- Зарегистрирован: 21 июл 2015, 18:30

Re: Как боросться с ошибками javaScript в WebGl
![]() IDoNotExist 12 мар 2018, 12:51
IDoNotExist 12 мар 2018, 12:51
Неотловленный Exception в коде где то вылазит, если при перезагрузке страницы, то возможно в OnDestroy. Смотри в эдиторе какие эксепшены вылезают. Либо в Build Settings ставь нужный тебе Enable Exceptions, почитать про ниж можно тут https://docs.unity3d.com/Manual/webgl-building.html.
-

IDoNotExist - Адепт
- Сообщения: 1432
- Зарегистрирован: 23 мар 2011, 09:18
- Skype: iamnoexist

Re: Как боросться с ошибками javaScript в WebGl
![]() юnity 12 мар 2018, 16:43
юnity 12 мар 2018, 16:43
А как в эдиторе то я же в интернете? Стрип енгин яя пробовал.Вы про это штоли?
Последний раз редактировалось юnity 12 мар 2018, 16:49, всего редактировалось 1 раз.
Give exact coordinates of the decision of the problems
-
юnity - UNITрон
- Сообщения: 290
- Зарегистрирован: 21 июл 2015, 18:30
Re: Как боросться с ошибками javaScript в WebGl
![]() IDoNotExist 12 мар 2018, 16:49
IDoNotExist 12 мар 2018, 16:49
юnity писал(а):А как в эдиторе то я же в интернете? Стрип енгин яя пробовал.
Забористо однако, где взял?
-
IDoNotExist - Адепт
- Сообщения: 1432
- Зарегистрирован: 23 мар 2011, 09:18
- Skype: iamnoexist
Re: Как боросться с ошибками javaScript в WebGl
![]() юnity 12 мар 2018, 16:53
юnity 12 мар 2018, 16:53
Обновил пост.
Give exact coordinates of the decision of the problems
-
юnity - UNITрон
- Сообщения: 290
- Зарегистрирован: 21 июл 2015, 18:30
Re: Как боросться с ошибками javaScript в WebGl
![]() IDoNotExist 12 мар 2018, 16:55
IDoNotExist 12 мар 2018, 16:55
Если без шуток, то у тебя в твоём С# коде, Exception вылезает и на это WebGL ругается, это достаточно понятно? Если да, то пошли далее, ты понимаешь чем Strip Engine Code отличается от Enable Exceptions?
-
IDoNotExist - Адепт
- Сообщения: 1432
- Зарегистрирован: 23 мар 2011, 09:18
- Skype: iamnoexist
Re: Как боросться с ошибками javaScript в WebGl
![]() юnity 12 мар 2018, 16:58
юnity 12 мар 2018, 16:58
Спосибо, ну я так думаю мне нужно сделать выбор на Full, там написано что сборка построится в менее строгой проверке кода, ибо я эти Exceptionы всё равно не отловлю, моё приложение же закрывается? Ну хотя можно попробывать через php… есть такая функция file_put_contents, которая в файл будет записывать какая ошибка, только сколько времени уйдёт «просто уму не постижимо». Но все равно спосибо. Значит есть ошибка.
/////////
Ошибку я нашёл. Как раз когда писал эту тему шла загрузка на хостинг, сразу после этого её возникновение исчезло. Повилось опять же новое припятствие. Но не хочу его мусолить. Объясните мне пожалуйста, как в таких случаях лучше поступить Full или No выбрать, что бы выбрать мягкий режим проверки кода для компилятора, на Denver бесполезно что то делать, а так такая уйма времени уходит.
Последний раз редактировалось юnity 12 мар 2018, 17:40, всего редактировалось 1 раз.
Give exact coordinates of the decision of the problems
-
юnity - UNITрон
- Сообщения: 290
- Зарегистрирован: 21 июл 2015, 18:30
Re: Как боросться с ошибками javaScript в WebGl
![]() ikhtd 12 мар 2018, 17:33
ikhtd 12 мар 2018, 17:33
ну а девелопмент билд делать и смотреть по отладке в каком методе выходит ошибка.
- ikhtd
- Адепт
- Сообщения: 1122
- Зарегистрирован: 24 мар 2014, 12:20
Re: Как боросться с ошибками javaScript в WebGl
![]() юnity 12 мар 2018, 17:41
юnity 12 мар 2018, 17:41
А там небыло ошибки, я как то забыл про Development написать он включен у меня
Вот сейячас сделал Full, появились Exceptinы ) даже пишет в какой функцие в C#, здорово, на знал. Спосибо IDoNotExist
Give exact coordinates of the decision of the problems
-
юnity - UNITрон
- Сообщения: 290
- Зарегистрирован: 21 июл 2015, 18:30
Вернуться в Общие вопросы
Кто сейчас на конференции
Сейчас этот форум просматривают: нет зарегистрированных пользователей и гости: 11