Debugging PHP code is part of any project, but WordPress comes with specific debug systems designed to simplify the process as well as standardize code across the core, plugins and themes. This page describes the various debugging tools in WordPress and how to be more productive in your coding as well as increasing the overall quality and interoperativity of your code.
For non-programmers or general users, these options can be used to show detailed information about errors.
Example wp-config.php for Debugging
The following code, inserted in your wp-config.php file, will log all errors, notices, and warnings to a file called debug.log in the wp-content directory. It will also hide the errors so they do not interrupt page generation.
// Enable WP_DEBUG mode
define( 'WP_DEBUG', true );

// Enable Debug logging to the /wp-content/debug.log file
define( 'WP_DEBUG_LOG', true );

// Disable display of errors and warnings
define( 'WP_DEBUG_DISPLAY', false );
@ini_set( 'display_errors', 0 );

// Use dev versions of core JS and CSS files (only needed if you are modifying these core files)
define( 'SCRIPT_DEBUG', true );
NOTE: You must insert this BEFORE /* That's all, stop editing! Happy blogging. */ in the wp-config.php file.
WP_DEBUG
WP_DEBUG is a PHP constant (a permanent global variable) that can be used to trigger the “debug” mode throughout WordPress. It is assumed to be false by default and is usually set to true in the wp-config.php file on development copies of WordPress.
// This enables debugging.
define( 'WP_DEBUG', true );
// This disables debugging.
define( 'WP_DEBUG', false );Note: The true and false values in the example are not surrounded by apostrophes (‘) because they are boolean (true/false) values. If you set constants to 'false', they will be interpreted as true because the quotes make it a string rather than a boolean.
It is not recommended to use WP_DEBUG or the other debug tools on live sites; they are meant for local testing and staging installs.
PHP Errors, Warnings, and Notices
Enabling WP_DEBUG will cause all PHP errors, notices and warnings to be displayed. This is likely to modify the default behavior of PHP which only displays fatal errors and/or shows a white screen of death when errors are reached.
Showing all PHP notices and warnings often results in error messages for things that don’t seem broken, but do not follow proper data validation conventions inside PHP. These warnings are easy to fix once the relevant code has been identified, and the resulting code is almost always more bug-resistant and easier to maintain.
Deprecated Functions and Arguments
Enabling WP_DEBUG will also cause notices about deprecated functions and arguments within WordPress that are being used on your site. These are functions or function arguments that have not been removed from the core code yet but are slated for deletion in the near future. Deprecation notices often indicate the new function that should be used instead.
WP_DEBUG_LOG
WP_DEBUG_LOG is a companion to WP_DEBUG that causes all errors to also be saved to a debug.log log file This is useful if you want to review all notices later or need to view notices generated off-screen (e.g. during an AJAX request or wp-cron run).
Note that this allows you to write to log file using PHP’s built in error_log() function, which can be useful for instance when debugging Ajax events.
When set to true, the log is saved to debug.log in the content directory (usually wp-content/debug.log) within your site’s filesystem. Alternatively, you can set it to a valid file path to have the file saved elsewhere.
define( 'WP_DEBUG_LOG', true );
-or-
define( 'WP_DEBUG_LOG', '/tmp/wp-errors.log' );
Note: for WP_DEBUG_LOG to do anything, WP_DEBUG must be enabled (true). Remember you can turn off WP_DEBUG_DISPLAY independently.
WP_DEBUG_DISPLAY
WP_DEBUG_DISPLAY is another companion to WP_DEBUG that controls whether debug messages are shown inside the HTML of pages or not. The default is ‘true’ which shows errors and warnings as they are generated. Setting this to false will hide all errors. This should be used in conjunction with WP_DEBUG_LOG so that errors can be reviewed later.
define( 'WP_DEBUG_DISPLAY', false );
Note: for WP_DEBUG_DISPLAY to do anything, WP_DEBUG must be enabled (true). Remember you can control WP_DEBUG_LOG independently.
SCRIPT_DEBUG
SCRIPT_DEBUG is a related constant that will force WordPress to use the “dev” versions of core CSS and JavaScript files rather than the minified versions that are normally loaded. This is useful when you are testing modifications to any built-in .js or .css files. Default is false.
define( 'SCRIPT_DEBUG', true );SAVEQUERIES
The SAVEQUERIES definition saves the database queries to an array and that array can be displayed to help analyze those queries. The constant defined as true causes each query to be saved, how long that query took to execute, and what function called it.
define( 'SAVEQUERIES', true );
The array is stored in the global $wpdb->queries.
NOTE: This will have a performance impact on your site, so make sure to turn this off when you aren’t debugging.
Debugging Plugins
There are many debugging plugins for WordPress that show more information about the internals, either for a specific component or in general. Here are some examples:
- Query Monitor
- Debug Bar
- Log Deprecated Notices
External Resources
- WordPress ‘wp-config.php’ file Generator
- ‘No White Screen’ plugin: Display the error instead of a white screen
No one likes to see errors on their website. Not only do they look bad to visitors and potential customers, but they also indicate that something’s wrong. But they’re, unfortunately, an inevitable part of running a site. The good news is that following a few best practices and being proactive can dramatically reduce the number of errors you experience.
One way to monitor potential site issues — or troubleshoot existing ones — is to keep and review an error log. Let’s dive into this a bit more.
What is error logging and why is it important?
Error logging is the process of tracking and monitoring issues that occur on a website. This is usually done with a record of simple text files that live on your web server and are updated whenever an error occurs. Error logs are used to identify the number of problems that occur, provide details about each one, and show when it took place.
How to enable error logging
To enable error logging on your WordPress site, you’ll need sFTP access, available with WordPress.com plugin-enabled plans. This allows you to edit your website files remotely. In this case, you’ll be working with the wp-config.php file, which holds the basic configuration settings for your website.
A word of warning: you should only use sFTP and edit your wp-config.php file if you feel comfortable doing so. Mistakes can cause catastrophic errors on your website. If you don’t have experience changing these types of files, you may want to hire a developer or reach out to WordPress.com support for help.
1. Connect to your website via sFTP
You’ll need to start by enabling sFTP on your site. Go to My Site(s) → Settings → Hosting Configuration and click the Enable SFTP button.
Then, you’ll see your sFTP login details: URL, Port Number, Username, and Password. You’ll need to input these into FTP software, like FileZilla, to access your site. Follow these detailed instructions to connect to your WordPress.com website.
2. Find and download your wp-config.php file
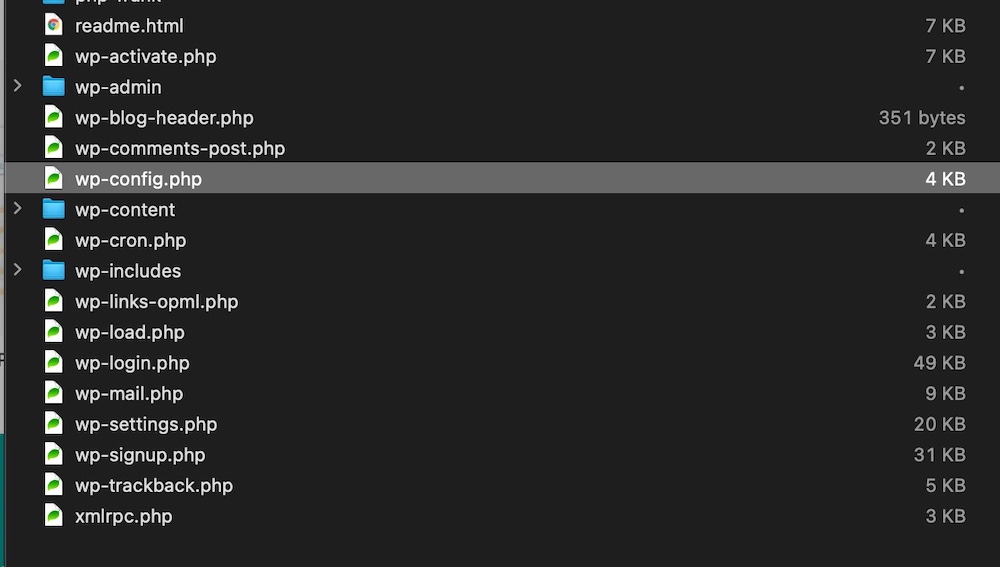
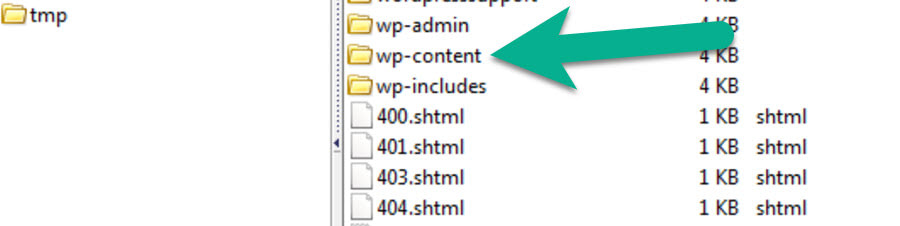
Navigate to your wp-config.php file. This sits in the root directory of your file structure, alongside folders such as wp-content. Download this file, so you have a backup copy on hand.
3. Edit the wp-config.php file
Edit your wp-config.php file using a text editor such as Notepad.
Look for define( ‘WP_DEBUG’, false ); and replace this text with the following:
define( ‘WP_DEBUG’, true );
if ( WP_DEBUG ) {
@error_reporting( E_ALL );
@ini_set( ‘log_errors’, true );
@ini_set( ‘log_errors_max_len’, ‘0’ );
define( ‘WP_DEBUG_LOG’, true );
define( ‘WP_DEBUG_DISPLAY’, false );
define( ‘CONCATENATE_SCRIPTS’, false );
define( ‘SAVEQUERIES’, true );
}
You’ve now successfully enabled error logging. You should only have this feature turned on while troubleshooting. Otherwise, it can leave your site more vulnerable to hacking attempts. To disable logging, simply delete the code you just added and restore the following:
define( ‘WP_DEBUG’, false );
How to view the error log manually
Once the log is enabled, you’ll need to load your website to trigger any error codes. Those codes are stored in a file called debug.log, which you can access via sFTP by following the same steps as above.
You can find the debug.log file inside of the wp-content folder. If there are errors, the file will appear. However, if there aren’t any errors, then you won’t see it at all — congratulations!
Once you find the file, download it to your computer to view the full log, using a text editing software like Notepad. It will look something like this:

This file will provide valuable information that will point you, or your developer, to the source of your problem.
How to view the error log using a plugin
Using a plugin to find your error log can be an easier and faster method, depending on your level of experience. In the WordPress dashboard, click on Plugins → Add New. Search for “Error Log Monitor” and click Install → Activate.
This plugin installs a widget on your WordPress dashboard that allows you to access your error log. If you haven’t enabled error logging correctly, the widget will display instructions on how to do so. However, you should ignore these instructions, as they’re incorrect for a WordPress.com installation. Instead, use the ones listed above.

If you can’t see the dashboard widget, click on the Screen options tab at the top of the WordPress dashboard and ensure that “PHP error log” is checked.

How to find the plugin or theme that’s causing an error
Error logs are not inherently easy to read, but they do give insightful information into the cause of an error.
Typically, each line in your error log will display a message, alongside the date and time it happened and the file in which the error occurred. It also lists the line number where the error is located. For example:
Apr 20, 15:08:59
Notice: Undefined index: fg2 in /wordpress/themes/pub/varia/functions.php on line 166
Let’s break this down. First of all, there’s the date and time of the error: April 20, 15:08:59. This helps you determine if this was a one-off glitch or a recurring issue.
Then, you can see the type of error that’s been logged. Here are a few common types of error you may see here:
- Notice. These are more warnings than errors, as they don’t actually stop your website code from executing. While you should still address a notice, your site will most likely still function, although potentially not as designed.
- Parse error. This is typically the result of a mistake in the syntax of the underlying PHP code of the website (often in a theme or plugin). Parse errors include things like missing semicolons, parentheses, and other similar mistakes. A parse error will stop executing code when it hits the problem, so your site may look visibly broken or not function as intended.
- Fatal error. This is often caused by undefined functions or classes, like a typo or poor coding practice. You can avoid it by using high-quality code, along with functions such as class_exists or function_exists.
In this case, the error is a notice.
Next, we see the error itself. In the example above the error is “undefined index.” This is followed by the specific location of the problem. In the above example, the error is occurring with the functions.php file of the Varia theme.
How to fix errors
Now that you can see your errors, it’s time to troubleshoot. Here’s a few things you can try:
- If you’re a developer and the error is in your custom code, go to the line number in the log entry and work to debug.
- If the error is within a theme or plugin, start by checking for any available updates. Keeping your plugins and themes up to date is critical for avoiding bugs and maintaining website security. Once you’ve applied any updates, re-check the error log to see if there are any new entries. If the error still exists, reach out to the plugin author or consider switching to an alternative.
- The error may also be caused by a conflict between two plugins. Try using the WordPress troubleshooting mode to fix this problem.
- If the problem occurred immediately after installing or updating a plugin, deactivate it to see if the error persists. If it doesn’t, the plugin is the likely cause and you may want to find an alternative. If the error occured after a core update, you may need to manually deactivate plugins to find the source.
Troubleshooting with the WordPress error log
WordPress, like any software, may occasionally run into problems. It may seem confusing to find and fix those problems, but the error log can be a huge help! It enables you to learn valuable information that can help you troubleshoot and solve site errors in a timely manner.
To avoid errors, always use well-maintained plugins and themes, and keep on top of updates. Need more help? If you have a WordPress plugin-enabled plan, you benefit from world-class Happiness Engineers that can provide guidance.
If you are trying to understand how the WordPress error logs works, you are in the right place! In this guide, we will cover all what you should know about it.
Monitoring PHP errors is something you need to do if you want to keep your WordPress website secure, healthy, and fast. If not fixed, PHP errors can indeed reduce your website performance and increase your website vulnerability to downtime and hackers.
That’s why, in this article, I’ll explain to you what you need to know about the PHP error logs in WordPress: from how to enable WordPress Error Log to implementing a reliable PHP monitoring solution.
Let’s get started with two definitions! If you are in a hurry, you can directly go to the PHP monitoring plugins section.
Table of contents
- What Are PHP Errors?
- What Is a WordPress Error Log?
- Using WordPress Error Logs to Troubleshoot PHP Errors
- How to Check PHP Error Logs in WordPress?
- Monitor WordPress PHP errors logs with a plugin
- Editing the configuration file for Debugging (enabling error log in WordPress)
- Monitor WordPress PHP errors logs with a plugin
- How to Fix The PHP Errors That You Found in The Error Log?
TL;DR
A WordPress website can be affected by a variety of errors, including permission issues and PHP issues. If you don’t have any technical experience, it can be challenging to diagnose these problems on your site.
You can turn your wp-config.php file into a debugging tool by adding a few lines of code. Once you’ve identified the problem, it will be easier to troubleshoot it.
To activate WordPress error logs add define( ‘WP_DEBUG’, true ); above “Stop editing! Happy blogging”. in wp-config.php file.
What Are PHP Errors?
PHP is the coding language WordPress is built on. When a user requests a web page that contains PHP code, the code is processed by the PHP module (Apache or Nginx) installed on the server.
Processing a request can generate PHP errors. This means that something is wrong with the PHP code. The error can be as simple as a missing semicolon, or as complex as calling an incorrect variable.
PHP errors can be triggered by theme, plugins, database, or server configuration. That’s one of the reasons why you should not install too many plugins on your WordPress websites.
Note that, the most PHP errors that you can see on your WordPress site are usually warnings and notices. This being said, some of them (fatal errors, internal server error, etc) can stop your website from loading.
Here are some of the PHP errors you can encounter.
What Is a WordPress Error Log?
Indeed, even if your website seems to be working well, it may in fact be suffering from undetected PHP errors that should be fixed ASAP. The WordPress error log gives you the list of these errors.
Error logs provide you with information such as the error type, the error line, and the file concerned. You should use WordPress error logs to troubleshoot arising issues or understand why they’ve happened.
Using WordPress Error Logs to Troubleshoot PHP Errors
If my explanation still looks blurry and if you don’t see the point of enabling the debugging mode for WordPress, here are some situations where you might really need it:
- When your WordPress website doesn’t load (blank page);
- When your web browser displays a warning with a PHP error code;
- If a plugin isn’t working properly;
- In case of downtime;
- If your website is really slow;
- If you want to improve your website performance & security;
How to Check PHP Error Logs in WordPress?
There are two ways to access PHP error logs in WordPress: manually or with a monitoring plugin. I’d personally advise to use WP Umbrella to monitor your PHP errors. It’s clearly the easiest way.
Monitor WordPress PHP errors logs with a plugin
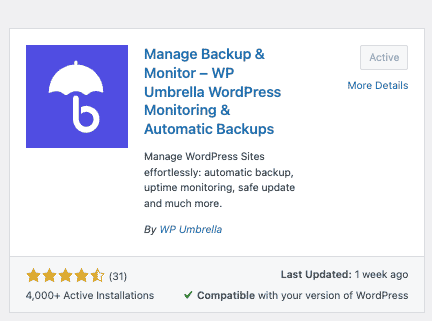
Step 1: Get WP Umbrella Monitoring Plugin
WP Umbrella is a all-in-one solution to manage WordPress sites. It embed a PHP errors monitoring feature for WordPress.
WP Umbrella is interesting because it also checks your website’s uptime rate and provide you with automatic backups.
You need to install the plugin, create an account and connect your API key.
Step 2: Go to the PHP errors monitoring tab
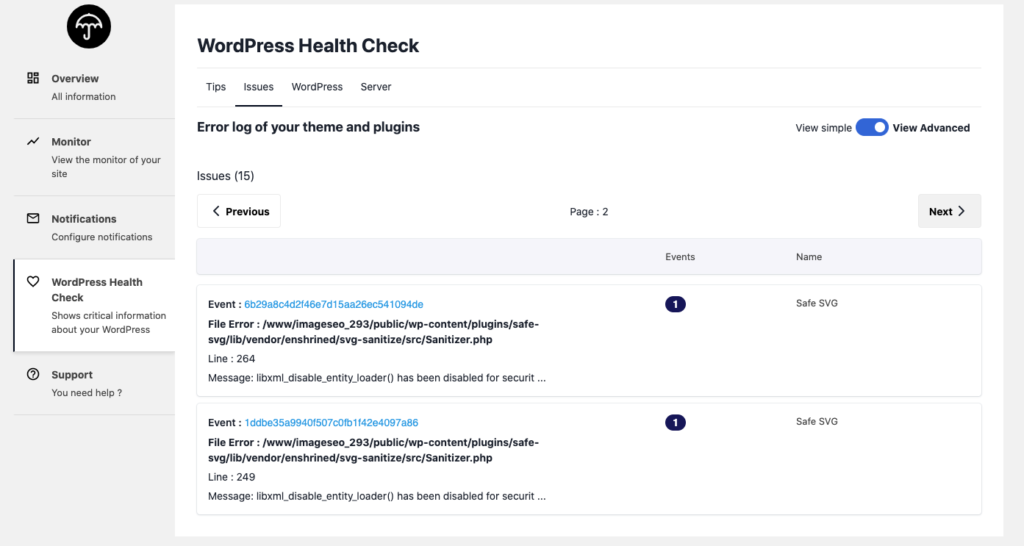
Then, go to WP Umbrella’s application >> PHP issues.

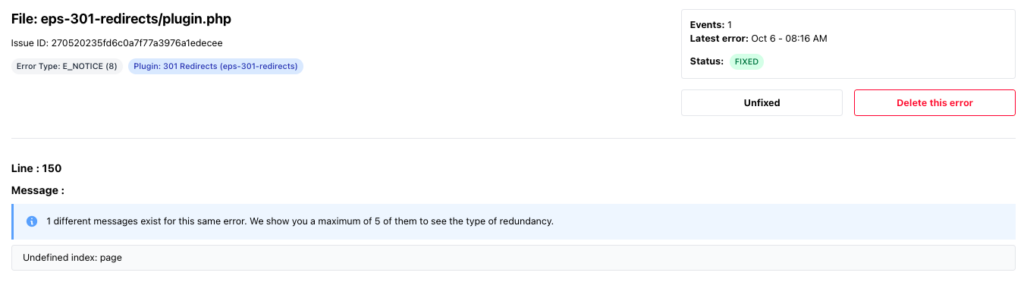
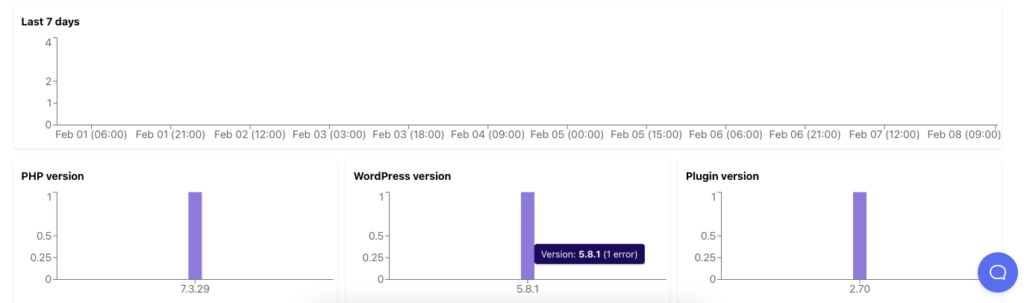
From here, click on the “view error” to get all the information related to the PHP errors such as:
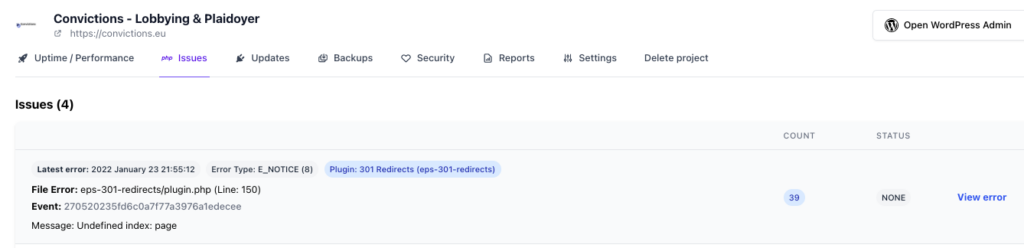
- The type of PHP error
- The plugin or theme responsible
- The environnement information (PHP version, plugin version, WordPress version)
- When the PHP error happened
That’s it, easy peasy!
Editing the configuration file for Debugging (enabling error log in WordPress)
If you don’t want to use an error log plugin like WP Umbrella or Query monitor, you can enable WordPress error log and retrieve PHP errors from here.
Step 1: Access the wp-config.php file
The wp-config.php file contains important WordPress settings like how to connect to your database. This is the file you need to edit in order to enable WordPress debugging mode and access WordPress error logs where you will find your PHP errors.
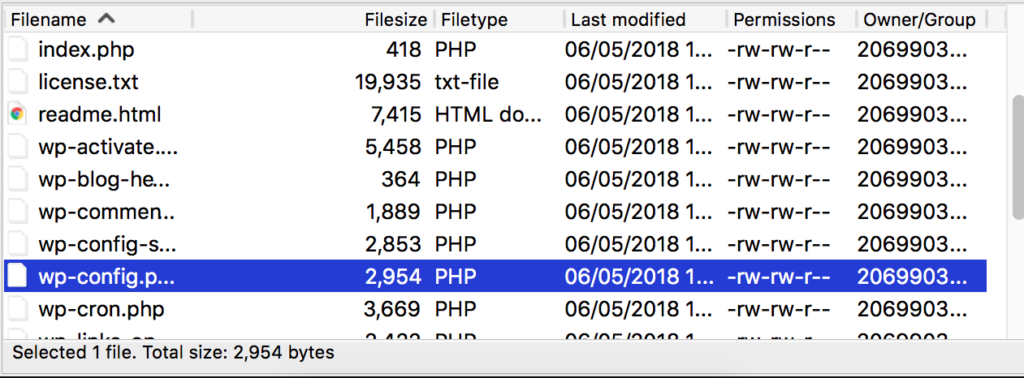
First, you need to connect to your website using an FTP client. Then, download the wp-config.php file to make a backup of it. Then you can start editing it with your favorite HTML editor.
Step 2: Edit the wp-config.php file
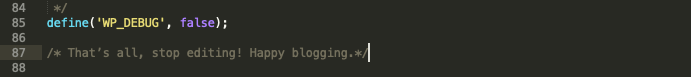
Just before the line “That’s all, stop editing! Happy blogging” add this:
define( ‘WP_DEBUG’, true );
define( ‘WP_DEBUG_LOG’, true );
Or write true instead of false if the WP_debug function is already defined.
WP_DEBUG will allow you to enable debug mode and WP_DEBUG_LOG will allow you to send all errors to a file, so PHP errors are not displayed on your pages.
Save your changes and upload the file back to your website. The errors will then get logged to the debug.file within your wp-content folder. If you don’t see the file, you can create one.
This is where your WordPress error logs will be stored.
How to Fix The PHP Errors That You Found in The Error Log?
Regrettably, there’s no magic and universal approach to fixing issues that you discovered in your WordPress website’s error log. Every PHP error will need to be troubleshot on its own.
If the PHP error is created by a third-party plugin you need to contact the plugin editor support so it can be fixed permanently. If you try to fix it yourself, the error might just happen again the next time the plugin is updated.
If you are looking for further information, you should check the official documentation of PHP.
If you like this article, you might be interested in our section “troubleshoot WordPress errors“.
PHP error logs are one of the most useful tools for diagnosing web hosting issues. It’s often difficult to find the cause of unexpected behavior in WordPress® and other PHP applications. PHP error logs, including WordPress logs, can help you to spot problems and identify the offending plugin, theme, or custom code.
In this article, we describe what PHP error logs are and why they’re useful, before explaining how to use cPanel & WHM to activate and configure both WordPress logs and the PHP runtime’s logging functionality.
What is a PHP Error Log?
A PHP error log lists warnings and error messages, which are generated by the language runtime and saved to a file. WordPress is written in PHP, so it handles WordPress’s error messages and logging.
Errors occur for lots of reasons. A line of code might have a typo in it, or the code might be fine, but something unexpected happens when it’s executed. Either way, the developers want to let you know, so they write code to log a message to a file. Error logs are a time-ordered list of these messages.
Error logs are incredibly useful for figuring out why WordPress isn’t behaving as you think it should. If it’s consuming excessive server resources, a plugin is broken, or pages don’t load, the logs can tell you why. If you’re in a “White Screen of Death” situation where WordPress isn’t working at all, the logs might be the only way to see what’s going on under the hood.
Before you can troubleshoot with logs, you’ll need to tell WordPress or PHP to start logging. Error logs are off by default because logging consumes server resources. They can also be a security risk if the wrong person sees them; logs sometimes have clues about potential vulnerabilities.
We’re going to look at two approaches to configuring error logging in cPanel. They are:
- Activating WordPress logging via the wp-config file.
- Activating PHP logging via the php.ini file.
Both can be done quickly in cPanel & WHM.
WordPress Error Logs with Wpconfig.php
The wp-config.php file contains WordPress’s configuration, and, with a couple of lines of code, you can turn on debugging mode and tell WordPress to write errors to a log.
First, fire up cPanel’s File Manager, which you will find in the main page’s Files section.
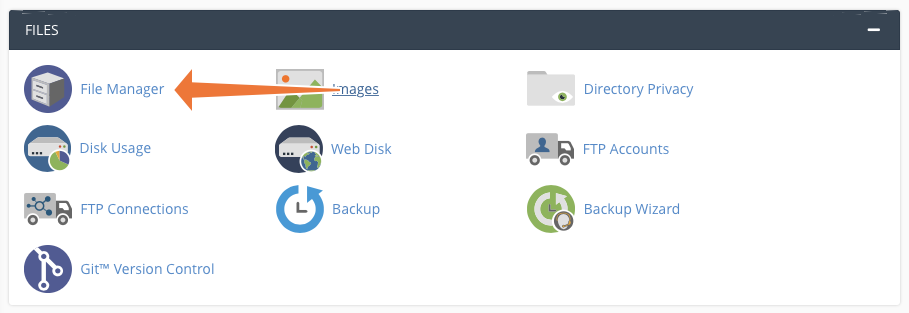
Your WordPress site is probably in the root or a subdirectory of public_html, although it might be somewhere else if your server has a non-standard configuration.
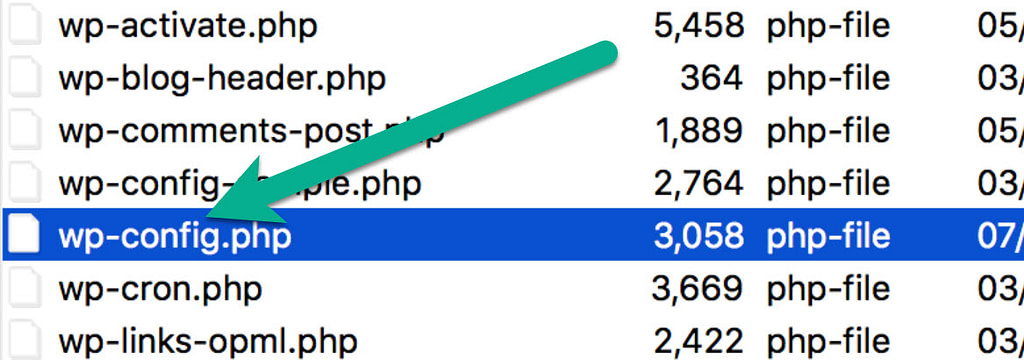
Click on the directory containing the site and find the wp-config.php file in the right-hand pane. Select it and click Edit in the menu bar.
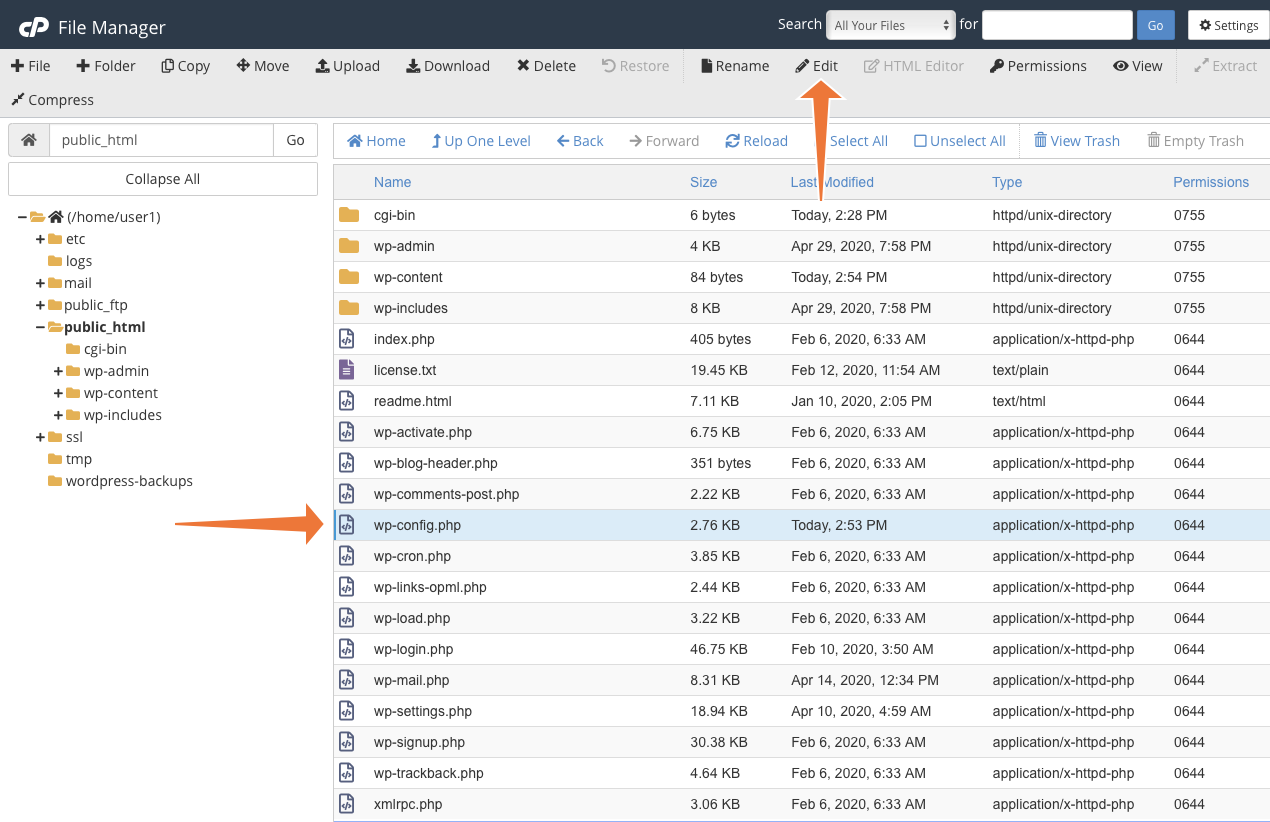
The file opens in cPanel’s text editor. Scroll down to the line that reads:
/* That's all, stop editing! Happy blogging. */Add the following code above that line and then click Save:
define( 'WP_DEBUG', true );
	define( 'WP_DEBUG_LOG', true );
	define( 'WP_DEBUG_DISPLAY', false );
@ini_set( 'display_errors', 0 );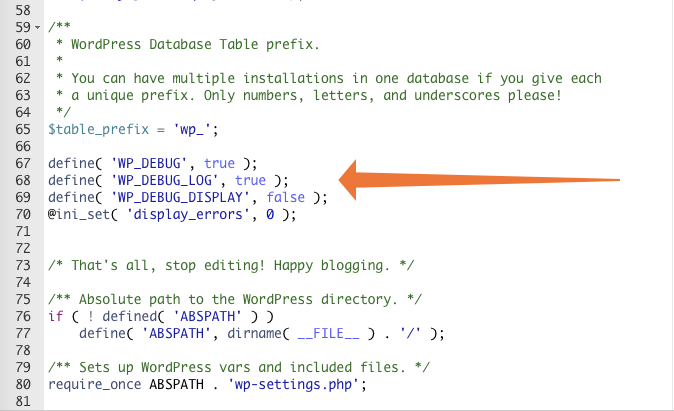
We’re telling WordPress to turn on debugging mode and output error messages to the log file. We also tell it not to display errors in the interface, because that’s not a good look for a production website.
WordPress will now write error messages to a file called error.log in the wp-content directory, which is in the root directory of your WordPress site.
You can use the cPanel File Manager and text editor to open this file and see the error messages. The most recent messages are at the bottom of the file. They tell you the type of error and which code triggered it, allowing you to track down the plugin or theme file responsible.
When you have diagnosed the problem, be sure to delete the logging code you added to the configuration file. The error file will keep growing and will eventually consume a large chunk of your disk allocation.
How To Log PHP Errors Beyond WordPress
The method outlined above is great if you want to manage logging through WordPress, but what if you want to log errors for other content management systems and applications?
To achieve widespread logging, you can add code to the php.ini file, which you can edit in cPanel’s MultiPHP INI Editor. You will only be able to edit this file if your web hosting environment allows it.
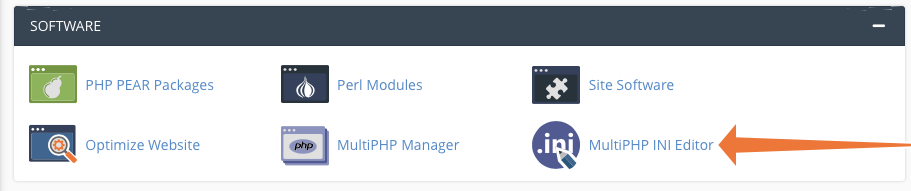
Select the Editor tab and then a location in the dropdown menu. cPanel displays the existing configuration file, which may be blank.
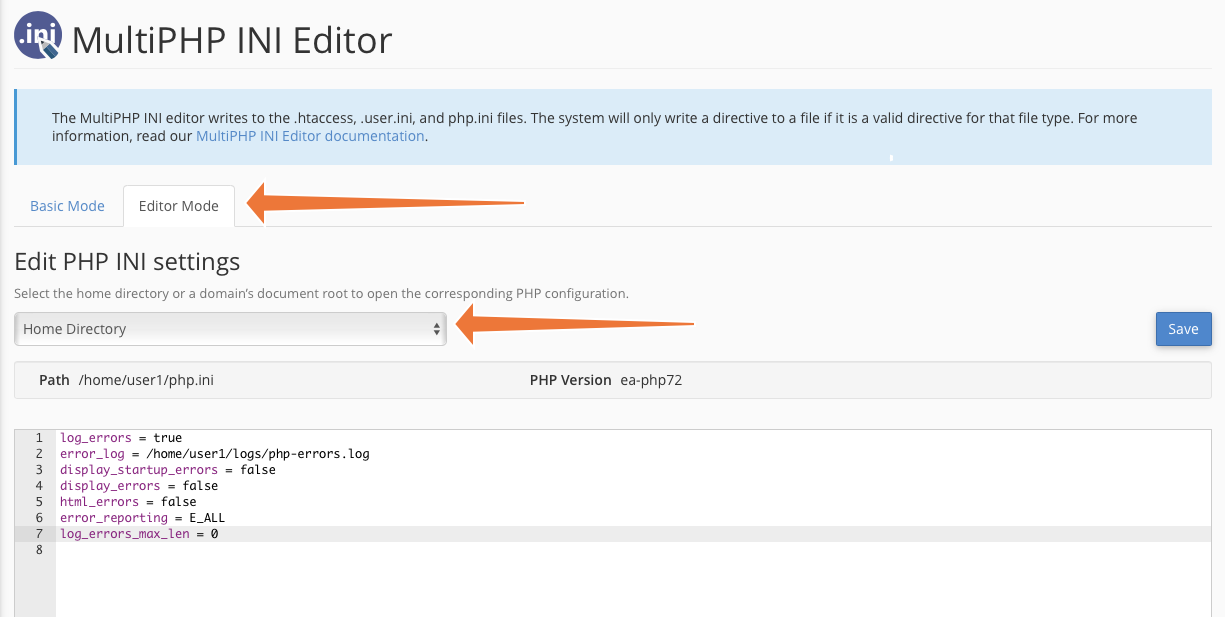
Add the following to the text entry field and click Save.
log_errors = true
error_log = /home/user1/logs/error.log
display_startup_errors = false
display_errors = false
html_errors = false
error_reporting = E_ALL
log_errors_max_len = 0
These directives tell the runtime to log errors to the file designated with error_log, which you should change to your preferred location. We’ve turned off startup errors because they are rarely relevant for debugging misbehaving applications. We also instruct PHP not to display errors in web pages because we don’t want users to see them.
Click Save, and PHP will start to log errors to the file you chose. You can access the log via the cPanel File Manager or by logging in with SSH.
The php.ini directives we used are suitable for most web servers, but you can use many other directives to configure PHP. To learn more, take a look at the list of php.ini directives in the language’s documentation and our MultiPHP INI Editor documentation.
Once you have used the logs to figure out your issue’s source, remove the code you just added or change the log_errors value to false to deactivate logging.
Efficient Issue Resolution with PHP Error Logs and cPanel
Logs are an enormously useful tool for diagnosing and fixing unexpected behavior in WordPress sites and other web applications. With cPanel & WHM, it’s straightforward to activate and deactivate logging, reducing the time you spend hunting down elusive issues.
As always, if you have any feedback or comments, please let us know. We are here to help in the best ways we can. You’ll find us on Discord, the cPanel forums, and Reddit.
WordPress is the world’s #1 Content Management System because it is both remarkably versatile and remarkably effective. However, nothing is perfect. WordPress runs on PHP, a scripting language created by a Danish programmer in 1994. Originally the letters stood for “Personal Home Page”, but it has since been re-styled (rather clumsily) to mean “PHP: Hypertext Preprocessor”.
Like any computer language PHP does not tolerate mistakes. Even the tiniest syntax flaw will generate an error, and those errors can range from the nuisance variety to ones that derail an entire website. When PHP errors happen it’s vital you get on top of them quickly. And the best, most effective way to do that is to enable WordPress error logs.
About PHP Error Logs
A PHP error log is a running list of all error messages and warnings generated by WordPress in relation to your website. There are a lot of reasons why such errors might occur. A developer may have added some incompatible script to one of the site’s PHP files. Or there may be compatibility issues with a plugin. Or something unexpected may happen when a visitor to the site tries to use some embedded feature.
Whatever the issue, it’s vital that there be a record of it so that the developer can track down and correct the problem. That’s what the error log is for. While an experienced developer might know instinctively what is going on in a given situation, it’s still useful for them to have a log available to confirm their suspicions. And for less tech-savvy developers, the log is an absolute essential if they are to get to the bottom of things. So, let’s look at how to enable WordPress PHP error logs.
Enabling WordPress Logs to Monitor PHP Errors
One thing that makes the process of tracking a PHP error in WordPress a fairly straightforward affair is the fact that WP already includes what is known as “debugging mode”. Debugging mode is designed to track and log PHP errors.
“Great! So what’s the problem?” you say. Well, the problem is that debugging mode is, by default, deactivated. And activating it is not as simple as clicking a button. Fortunately, it’s not as difficult as pulling teeth either. Here are the steps to take to activate debugging mode and access those error files.
Note: Make sure to make a backup of your site before proceeding with the PHP debugging activation process. This will enable you to reset the site to its current state should you make an error of your own while attempting to activate PHP debugging mode.
Activate PHP Debugging Mode: Step 1
The first thing you will need to do is gain access to your WordPress core files, including the PHP files. This cannot be done using the WP dashboard. Instead, you will need to use an FTP client like Filezilla to gain direct access to these files.
If you don’t already have Filezilla installed on your computer it’s available as a free download and takes about a minute to install. Once installed, all you need do to log in this way is enter your FTP credentials. If you don’t have your FTP login info handy, you can obtain it from your web hosting company, typically through the control panel.
When you have the information you need, log into your site via FTP.
Activate PHP Debugging Mode: Step 2
Once you have logged in using your FTP client, you will see your WordPress directories and files listed on the right-hand side of the FTP client interface. Scroll down through the listed files until you find the one called “wp-config.php”. “Config” stands for “configuration” and should give you some clue as to how important this file is. Which is why it should never be altered for trivial reasons.
Once you locate the wp-config file, right-click on it and select the “edit” option from the menu that appears. The file will open up in Notepad, (or whatever other program you use as your computer’s default text editor). Scroll down through the file until you see the following line of code:
define( 'WP_DEBUG', false );Change it to…
define( 'WP_DEBUG', true );That’s it. Don’t change anything else in this line. Don’t close or add any spaces. Just change the word false to the word true. That will enable PHP debugging mode.
With that, you are halfway home. Now you have to tell WordPress to create a PHP error log so you can see important information about the problem you are currently having. To do that, scroll down a bit more in the config PHP file until you come to the following line:
define( 'WP_DEBUG_LOG', false ); Change it to…
define( 'WP_DEBUG_LOG', true ); Once set to true, this command tells WordPress to create a file called “debug.log” that you will be able to find within the /wp-content/ directory. The debug.log file will list any and all PHP errors being generated by your site so you can then initiate corrective measures.
After making the above changes to the wp-config.php file you will need to save them. Saving the file will likely prompt your FTP program to ask you if you want to replace the existing file with the new, modified file. Click “yes” and close the file.
Trigger the Error Again
Now that you have modified the wp-config PHP file to activate debugging mode and create an error log, you can use that error log to see what is going wrong and fix it.
But first, you have to trigger the error that started all this. That’s because WordPress is not going to list any errors that occurred before you activated debugging mode. Therefore, until you trigger it again your new debugging log is going to be empty. So go back to your website and trigger the error again.
Locate the New PHP Error Log and Evaluate the Problem
Once you have triggered the error, go back to the FTP client, navigate to the root folder for your website, and look for the “wp-content” folder. Open it. Inside that folder, you will see the new debug.log file. Open it with your default text editor. It should list the error you just triggered and indicate what caused it.
Fixing the Problem
The new debug.log file will list any and all PHP errors encountered after it was created. But it does not fix anything or make any specific recommendations about how to fix the problem(s). All it does is list the PHP errors. So you have a couple of options.
First, you can attempt to decipher the PHP error log, track down the problem yourself and try to fix it. But this is rarely as easy as it sounds. You will need to be fairly tech-savvy and should have some experience troubleshooting PHP. If you do, great! If you don’t, you’re asking for trouble.
Another option is to copy the contents of the debug.log file, post them on a WP forum and ask for help. You may understand the answers you get, or you may not. If it’s all still Greek to you, then the best thing to do is to hire a professional familiar with PHP to handle the fix for you. Yes, you’ll have to part with a few ducats. But in the long run, it will be worth it.
Important Note: Once you have resolved the PHP error in WordPress that was causing the trouble, it’s important that you go back into the config.php file and deactivate debugging mode. This is especially crucial if your site is live. Leaving it activated will likely slow down your site and it may leave you exposed to hackers.
Conclusion
Being able to log a PHP error in WordPress is crucial if you are to solve a problem that is plaguing your website. Follow the steps laid out above and you’ll be on your way to setting things right. And in case things get complicated, we’ll be glad to help.
Themeisle content is free. When you purchase through referral links on our site, we earn a commission. Learn More
From conflicts between WordPress plugins to poorly coded themes and mistakes in custom coding, several problems sound the alarm with website error codes and warnings. Even if you’re not sure what the warnings mean, you must fix them. The first step is learning how to set up a WordPress error log.
As a short explanation, a WordPress error log is exactly what it sounds like: a list of error codes and times that occur on your website.
In this post, we’ll show you how to set up and work with WordPress error logs using the built-in WordPress debug mode.
When should you set up a WordPress error log?
Consider setting up a WordPress error log in the following situations:
- When you see a blank screen while trying to load your website.
- When a warning with an error code (401, 404, 500, etc.) appears.
- If your entire site crashes.
- If you’re noticing slow website performance.
- If a plugin or theme isn’t working properly.
- If you’re curious as to which plugins or themes are causing performance issues.
As is often the case with WordPress, you have two routes to enable error logging with WordPress debug mode:
- Manually
- With a plugin
We’ll start by showing you the manual method, which just involves adding a few code snippets to your site’s wp-config.php file.
Then, if you want an even simpler option for error logging, we’ll share a free plugin that can get the job done.
Here’s how to do it manually…
Click here if you’d rather jump to the plugin 👈
Step 1: Access and edit the wp-config.php file
If you’re not familiar with your wp-config.php file, it’s one of the core files for holding important configuration details, like the credentials for your site’s database.
To access the wp-config.php file, either download and use an FTP client or a file manager tool in your host’s cPanel.
How to use FTP to connect to WordPress 👈
For this tutorial, we’ll cover the steps to access and edit your wp-config.php file with an FTP client.
In your FTP client, locate the wp-config.php file. This is normally in the root site directory.
Upon finding the file, right-click on it and select to edit or view the file. You’ll want to open the file in a text editor.
Step 2: Add a line of code in the wp-config.php file to turn on debug mode
Inside your text editor, search for a line of text that reads Stop editing! Happy blogging.
Place your cursor on the empty line above that line of text.
Paste in the following code:
define( 'WP_DEBUG', true );If you already notice this line of code in the file, it may currently be set to false. If that’s the case, switch it to true.
Afterward, save the file to your computer and upload the wp-config.php file as an update to your website. This is done through the FTP client.
Great! Now debugging mode is activated for your WordPress site.
Step 3: But wait! I don’t want the errors to show on the frontend of my website
If you took a moment to check your dashboard or the frontend of your site, you may have already seen WordPress errors listed for everyone to see. This may not seem like a big deal if they show up on the WordPress dashboard, but you definitely don’t want the warnings on the frontend.
Not only is publicly displaying errors confusing for your visitors, but it can also be a security risk because it gives them detailed information about your site.
In short, debugging mode is messy when activated by itself.
Therefore, we need to log the errors in WordPress so they are recorded but not publicly displayed.
To log your errors, go back to that exact same wp-config.php file in the text editor.
Look at the debug code you recently pasted into the file. Paste the following new code on the empty line below the debug code:
// Enable Debug logging to the /wp-content/debug.log file
define( 'WP_DEBUG_LOG', true );

// Disable display of errors and warnings
define( 'WP_DEBUG_DISPLAY', false );
@ini_set( 'display_errors', 0 );
Again, in some situations you might discover that the debug log code is already included. For that, simply make sure that the false at the end of the code is changed to true.
The first line tells WordPress to save error messages to a file called debug.log. The second snippet tells WordPress not to publicly display error messages.
Now, your error messages will be safely saved in the log file, but neither you nor your visitors will have to see error messages while browsing your site.
For a second time, save the wp-config.php file in your file editor and upload it back to your WordPress website.
How to use a WordPress error log plugin
If you don’t feel comfortable working directly with your site’s configuration file, you can also use the free WP Debugging plugin:
As soon as you activate the plugin, it instantly activates WordPress debug mode and enables error logging. It also lets you control whether or not to display debug messages on your site by visiting Tools -> WP Debugging.
Checking your WordPress error logs
We’re assuming you already know the website pages that are alerting you of errors.
You must visit these pages now that the debugging log is configured and ready to store the errors.
Reconnect to your website files using the FTP client. You can also connect via your host’s cPanel.
Go to the /wp-content/ folder.
Open that folder and look for a file called debug.log.
This is the file you created from the previous steps.
What should I do with this debug log file?
The debug.log file is accessible by editing, viewing, or downloading the file. It’s similar to the previous steps, where you might either just preview the file to look at it or open it in a file editor to make changes and save it for later.
Overall, a debug log file is for reference, not for editing. Therefore, you have to sift through the list of errors and warnings to identify what’s wrong with your site, theme, plugins, or code.

For most people, the error log codes mean nothing. If anything, it’s closer to gibberish than English. However, you don’t want to forget about those errors.
Your resolution steps should go like this:
- You identify an error with the debug log.
- You find the error code.
- You look up what that error code means.
- You utilize a separate guide to fix that error.
How to fix issues that you discover in the error log
Unfortunately, there’s no one-size-fits-all approach to fixing problems that you might discover in your site’s error log.
However, we do have lots of existing posts on how to fix common WordPress errors:
- A beginner’s guide to WordPress troubleshooting
- The most common HTTP error codes and how to fix them
- A guide for checking for plugin compatibility issues
- What is a 401 error and how do you fix it?
- How to fix any 404 errors with redirects
- How to fix the 500 internal server error in WordPress
- 4 ways to fix an error when establishing a database connection
- How to fix the white screen of death
If you’re still not sure how to fix the issues in your log file, you might want to hire a WordPress developer to do it for you – here are some tips to find the right developer.
Do you have any questions about how to set up a WordPress error log?
Even looking at bits of code feels intimidating for the average WordPress user.
The good news is that setting up a WordPress error log only takes two small snippets of code.
If you have trouble activating your WordPress error log, or questions on how to fix them, let us know in the comments below!
Free guide
5 Essential Tips to Speed Up
Your WordPress Site
Reduce your loading time by even 50-80%
just by following simple tips.
Download free guide
В разработке нужно иметь возможность смотреть где ошибка, когда что-то вдруг сломалось. В WordPress для этого есть специальный режим «дебаг» (режим отладки). В этой заметке разберем его на части и посмотрим что это за константа такая WP_DEBUG.
Зачем нужен «дебаг режим»?
Допустим, вы изменили код файла functions.php темы и сайт перестал работать. Вместо него белый экран — ничего не понятно. «дебаг» поможет разобраться, он покажет ошибку и скажет в какой она строке какого файла.
«Дебаг» выводит не только ошибки, из-за которых сайт перестает работать, но и заметки. Заметки могут создаваться самим PHP (например, когда неправильно используется переменная) или кодом PHP скрипта (например, WP создает такие заметки, если сайт использует устаревшую функцию WordPress, или устаревший параметр функции).
Читайте также
-
пример исправления скорости загрузки сайта через профилирование слабых мест с помощью xDebug + phpStorm.
- Profiling WordPress Sites (видео)
Есть два варианта режима «дебаг»:
WP_DEBUG_DISPLAY— Константа показа ошибок на экран.WP_DEBUG_LOG— Константа запись ошибок в лог файл.
Сам «дебаг» режим включается константой WP_DEBUG.
Все три константы могут принимать значения true или false.
По умолчанию константы дебага имеют такие значения:
- WP_DEBUG = false (true при
'development' === wp_get_environment_type()) - WP_DEBUG_DISPLAY = true
- WP_DEBUG_LOG = false
Константы обычно определяются в файле wp-config.php.
wp_initial_constants() определяет дефолтные значения констнат, если они не установлены вручную. Функция срабатывает на раннем этапе загрузки WordPress.
wp_debug_mode() устанавливает настройки PHP на основе установленных констант.
WP_DEBUG_DISPLAY и WP_DEBUG_LOG активируются, только если включена константа WP_DEBUG.
Включение WP_DEBUG не изменяет значение других констант. Т.е. при WP_DEBUG=true WP_DEBUG_DISPLAY и WP_DEBUG_LOG сохранят свои дефолтные значения и на основе этих значений будут выставлены PHP настройки показа и логирования ошибок.
Отображение ошибок форсировано отключено для AJAX/REST/XMLRPC/JSONP запросов. См. код wp_debug_mode():
if (
	defined( 'XMLRPC_REQUEST' )
	|| defined( 'REST_REQUEST' )
	|| defined( 'MS_FILES_REQUEST' )
	|| ( defined( 'WP_INSTALLING' ) && WP_INSTALLING )
	|| wp_doing_ajax()
	|| wp_is_json_request()
) {
	ini_set( 'display_errors', 0 );
}
Как включить показ ошибок в AJAX запросе, сморите в статье про AJAX.
Важно отключать «дебаг» на рабочем сайте.
Как включить «дебаг» (показ ошибок в WordPress)
Базовое включение
Откройте файл wp-config.php в корне сайта и измените false на true в строке:
define( 'WP_DEBUG', true ); // false - отключить показ ошибок
При таком включении ошибки и заметки будут выводиться на экран, но ничего логироваться не будет.
Включение и настройка дебага
Код ниже, включит запись ошибок, предупреждений и заметок в файл wp-content/debug.log и выключит показ заметок и предупреждений на экране, чтобы они не мешались при просмотре сайта.
define( 'WP_DEBUG', true );     // включение дебаг режима
define( 'WP_DEBUG_LOG', true ); // true - логирование ошибок в файл /wp-content/debug.log
define( 'WP_DEBUG_DISPLAY', false ); // false - отключает показ ошибок на экране
define( 'SCRIPT_DEBUG', true ); // используем полные версии JS и CSS файлов движка
Вставлять этот код нужно в файл wp-config.php куда угодно, но до строки:
require_once( ABSPATH . 'wp-settings.php' );
Благодаря коду выше, было включено логирование ошибок в файл. Этим можно воспользоваться для записи содержимого переменных в этот файл:
error_log( $value );               // Скалярные величины
error_log( print_r( $value, 1) );  // Любые данные
Динамическое включение показа ошибок
Этот код помогает быстро включать константу WP_DEBUG, которая на рабочем сайте должна быть выключена. Также код позволяет включить запись ошибок в файл debug.log в папку /wp-content и отключить показ ошибок на экране.
Зачем это надо? Допустим, мы сделали сайт и на боевом сайте нам иногда нужно видеть ошибки (обычно конечно все это тестируется на локалке, но всякое бывает нужно). Чтобы видеть причину ошибки, нам нужно включить дебаг, но на боевом сайте где ходят пользователи делать этого не рекомендуется. С помощью кода ниже можно включить дебаг режим в WordPress через URL, зная определенный ключ.
Включение ошибок сохраняется в куку.
Установка
Замените строку define( WP_DEBUG, false ); в файле wp-config.php на такой код:
GitHub
<?php

/**
 * Dynamically enable/disable the display of PHP errors in WordPress.
 *
 * Installation:
 * replace line 'define( WP_DEBUG, false );' in 'wp-config.php' file with this code.
 *
 * Enabling debug mode:
 * NOTE: Strongly recommended to changing the 'debug' word to something more unique!
 * add the 'debug' query parameter to the URL. Examples:
 * https://site.com/?debug - default enabling of WP_DEBUG constant
 * https://site.com/?debug=1 - logging of errors into file 'DOCUMENT_ROOT/../php-errors-{HOST}.log'.
 * https://site.com/?debug=2 - linking uncompressed scripts and saving all SQL queries to $wpdb->queries
 * https://site.com/?debug=3 - saving all SQL queries in $wpdb->queries
 * https://site.com/?debug=4 - disable displaying errors (enabled by default)
 * https://site.com/?debug=14 - combining
 *
 * Disabling debug mode:
 * https://site.com/?debug=anything
 *
 * @author Kama (http://wp-kama.ru)
 * ver 2.5
 */
// IMPORTANT: change from `debug` to your unique key!
kama_define_wp_debug( 'debug' );

function kama_define_wp_debug( $key ){

	$val = isset( $_GET[ $key ] ) ? ( $_GET[ $key ] ?: 'yes' ) : false;

	// set/delete cookie
	if( $val !== false ){

		$cookie = preg_match( '/^(yes|[1234])$/', $val ) ? $val : null;

		$host = str_replace( 'www.', '', $_SERVER['HTTP_HOST'] );

		// cirilic domains: .сайт, .онлайн, .дети, .ком, .орг, .рус, .укр, .москва, .испытание, .бг
		false !== strpos( $host, 'xn--' )
			? preg_match( '~xn--[^.]+.xn--[^.]+$~', $host, $mm )
			: preg_match( '~[a-z0-9][a-z0-9-]{1,63}.[a-z.]{2,6}$~', $host, $mm );

		$host = $mm[0];

		$_COOKIE[ $key ] = $cookie;
		setcookie( $key, $cookie, time() + ( $cookie ? 3600 * 24 * 365 : -3600 ), '/', ".$host" );
	}

	// enable the debug based on the cookie
	if( ! empty( $_COOKIE[ $key ] ) ){

		define( 'WP_DEBUG', true );

		$set = array_flip(
			preg_split( '/(d)/', $_COOKIE[ $key ], -1, PREG_SPLIT_DELIM_CAPTURE | PREG_SPLIT_NO_EMPTY )
		);

		isset( $set[1] ) && define( 'WP_DEBUG_LOG', dirname( $_SERVER['DOCUMENT_ROOT'] ) . "/php-errors-{$_SERVER['HTTP_HOST']}.log" );
		isset( $set[2] ) && define( 'SCRIPT_DEBUG', true );
		isset( $set[3] ) && define( 'SAVEQUERIES', true );
		isset( $set[4] ) && define( 'WP_DEBUG_DISPLAY', false );
	}
	else {
		define( 'WP_DEBUG', false );
	}
}
Теперь, чтобы включить режим WP_DEBUG, нужно добавить в любой URL сайта параметр запроса debug: http://example.com/?debug или http://example.com/?debug=1 (принудительный вывод на экран, если такой вывод отключен) или http://example.com/?debug=2 (логирование в файл).
Для защиты, ключ debug нужно изменить на свой, который будете знать только вы, потому что по нему вы будете включить/отключать дебаг режим.
При включении логирования, не забывайте удалять лог файл, а то его может посмотреть кто угодно. Или путь до файла лога можно изменить см. описание WP_DEBUG_LOG.
WP_DEBUG
WP_DEBUG — это PHP константа (глобальная постоянная — определяется всего один раз). Значение этой постоянной включает или отключает показ ошибок в PHP, а также она используется в разных местах кода WordPress для показа или подавления ошибок, где это необходимо.
WP_DEBUG нужно определять (устанавливать) в файле wp-config.php из корня сайта.
define( 'WP_DEBUG', false ); // дебаг отключен. По умолчанию.
// или
define( 'WP_DEBUG', true ); // дебаг включен
Для удобности, можно писать числа 1 или 0:
define( 'WP_DEBUG', 0 ); // дебаг отключен. По умолчанию.
// или
define( 'WP_DEBUG', 1 ); // дебаг включен
Заметка: нельзя указывать false в кавычках — ‘false’. В этом случае дебаг будет включен, потому что значение равно строке false, а не логическому — нет.
PHP ошибки, предупреждения и заметки (errors, warnings и notices)
В PHP есть разные уровни ошибок. Если не вдаваться в подробности, то уровни значимости такие:
errors— серьезная ошибка, которая приводит к остановке скрипта. PHP прерывает работу.warnings— не ошибка, а предупреждение о чем-либо. PHP не прерывает работу.notices— не ошибка, а заметка о чем-либо. PHP не прерывает работу. Заметки могут показать возможные баги в коде. Их исправление, как правило, делает код более стабильным.
«Режим дебаг» включает все уровни ошибок. Это не похоже на обычное поведение PHP, там обычно включены только ошибки уровня errors, а warnings и notices не отображаются. Подробнее читайте в описании error_reporting().
Устаревшие функции, хуки и устаревшие параметры функций
WP_DEBUG также включает внутренние заметки самого WordPress. В WordPress есть специальные функции вроде _deprecated_function(), которые показывают ошибку уровня notices, когда используется устаревшая функция или хук или параметр хука, функции и т.д. Эти заметки предупреждают, что функция WP считается устаревшей и её нужно заменить, потому что она в любой момент может быть удалена. В таких заметках чаще всего предлагается альтернативная функция для замены.

WP_DEBUG_DISPLAY
По умолчанию: true.
Еще один компонент WP_DEBUG, который контролирует вывод (показ) ошибок на экран.
Зависит от WP_DEBUG! Работает только, если дебаг включен WP_DEBUG = true . В противном случае просто используется глобальное значение PHP опции display_errors.
Если указать в wp-config.php:
define( 'WP_DEBUG_DISPLAY', true )— (по умолчанию) WP будет выводить (показывать) ошибки на экран.define( 'WP_DEBUG_DISPLAY', false )— ошибки не будут выводиться на экран. Это нужно, когда ошибки записываются в файл (см. WP_DEBUG_LOG) и их можно смотреть позднее.define( 'WP_DEBUG_DISPLAY', null )— WP вообще не будет указывать значение для PHP опции display_errors, т.е. будет использована глобальная настройка PHP (сервера).
Показ ошибок всегда отключается для REST, AJAX или XML-RPC запросов. Для них срабатывает такой код ini_set( ‘display_errors’, 0 ), но при этом значение константы WP_DEBUG_DISPLAY не изменяется!
WP_DEBUG_LOG
По умолчанию: false
Еще один компонент дебага. Включает запись ошибок в файл /wp-content/debug.log. Зависит от WP_DEBUG — работает только если WP_DEBUG равен true.
Запись ошибок в файл может пригодится, когда нужно проверить наличие ошибок в коде, который ничего не выводит на экран. Например, при AJAX запросе или при тестировании CRON или REST.
define( 'WP_DEBUG_LOG', true ); // true - запись ошибок в файл /wp-content/debug.log
Изменение адреса файла лога ошибок
Через WP
C WordPress 5.1, в WP_DEBUG_LOG можно указать путь к файлу лога:
define( 'WP_DEBUG_LOG', '/srv/path/to/custom/log/location/errors.log' );
Через PHP
Чтобы изменить название файла, добавьте следующую строку как можно раньше, например в MU плагины:
ini_set( 'error_log', WP_CONTENT_DIR . '/hidden-debug.log' );
Но эту строку нельзя добавлять в wp-config.php — это слишком рано…
Имейте ввиду:
- Конечная папка в указанном пути должна существовать и быть доступна для записи.
- Файла внутри может не быть, он будет создан, как только произойдет первая ошибка.
SAVEQUERIES
По умолчанию: не определена.
Связанная с дебагом константана. При включении, все SQL запросы будут сохраняться в переменную $wpdb->queries в виде массива. В этом массиве можно будет посмотреть все SQL запросы и при необходимости найти нужный и убедиться что он правильный и т.п.
Кроме самого запроса, также записываются данные о том сколько времени занял запрос и какой функцией он был вызван.
define( 'SAVEQUERIES', true ); // true - сохраняет SQL запросы и данные о них в `$wpdb->queries`
Важно! что включение записи запросов, требует дополнительной памяти и PHP операций. Поэтому, в целях производительности, на рабочем сайте эта константа должна быть отключена.
SCRIPT_DEBUG
По умолчанию: false.
Связанная с дебагом константа. Контролирует какие JS и CSS файлы использовать: сжатые или полные. При включении WordPress будет использовать не сжатые версии (dev версии) JS и CSS файлов. По умолчанию используются min версии файлов. Это нужно для тестирования при изменении встроенных js или css файлов.
define( 'SCRIPT_DEBUG', true ); // true - использование полных версий `.css` и `.js` файлов
Как работает WP_DEBUG?
После установки констант дебага в wp-config.php мы заходим на сайт. И при генерации страницы, в самом начале загрузки WordPress (см. wp-settings.php) срабатывает функция wp_debug_mode(). Она, используя функции PHP, устанавливает как и какие уровни ошибок показывать, нужно ли создавать лог файл и т.д.
Не работает WP_DEBUG?
Иногда может возникнуть такая ситуация, когда вы включаете WP_DEBUG в конфиге, а ошибки все равно не видно. Такое поведение может возникнуть, когда где-то после установок параметров показа ошибок самим WordPress эти установки меняются. Например в MU плагине, обычном плагине или в теме, ошибки выключаются переустановкой ini директив PHP, примерно таким кодом:
error_reporting(0); // отключает сообщения об ошибках
ini_set('display_errors', 0); // отключает показ ошибок на экран
В этом случает установки дебага WP перебиваются и он перестает работать…
Для решения, лучше всего найти где изменяются настройки и удалить такие строки, чтобы дальше работать только с константой WP_DEBUG.
В качестве другого решения можно попробовать еще раз перебить настройки вывода ошибок, указав их снова:
error_reporting(E_ALL); // включаем сообщения об ошибках
ini_set('display_errors', 1); // включаем показ ошибок на экран
Функции WP для дебага
- wp_debug_backtrace_summary() — Получает трассировку с названиями функций — список названий всех функций/методов, которые были вызваны для того, чтобы добраться до текущего места в коде (откуда была вызвана эта функция).
- wp_get_environment_type() — Получает текущий тип окружения: local, development, staging, production (по умолчанию).
Данные системы
Для дебага в WP есть класс WP_Debug_Data. Например, используя следующий метод мы можем получить кучу данных о системе:
require_once ABSPATH . '/wp-admin/includes/class-wp-debug-data.php';
require_once ABSPATH . '/wp-admin/includes/update.php';
require_once ABSPATH . '/wp-admin/includes/misc.php';

$data = WP_Debug_Data::debug_data();

print_r( $data );
Получим большой массив данных:
Array
(
	[wp-core] => Array
		(
			[label] => WordPress
			[fields] => Array
				(
					[version] => array( data )

					[site_language] => array( data )

					[user_language] => array( data )

					[timezone] => array( data )

					[home_url] => array( data )

					[site_url] => array( data )

					[permalink] => array( data )

					[https_status] => array( data )

					[multisite] => array( data )

					[user_registration] => array( data )

					[blog_public] => array( data )

					[default_comment_status] => array( data )

					[environment_type] => array( data )

					[user_count] => array( data )

					[dotorg_communication] => array( data )

				)

		)

	[wp-paths-sizes] => Array
		(
			[label] => Directories and Sizes
			[fields] => Array
				(
					[wordpress_path] => array( data )

					[wordpress_size] => array( data )

					[uploads_path] => array( data )

					[uploads_size] => array( data )

					[themes_path] => array( data )

					[themes_size] => array( data )

					[plugins_path] => array( data )

					[plugins_size] => array( data )

					[database_size] => array( data )

					[total_size] => array( data )

				)

		)

	[wp-dropins] => Array
		(
			[label] => Drop-ins
			[show_count] => 1
			[description] => Drop-ins are single files, found in the /public_html/assets directory, that replace or enhance WordPress features in ways that are not possible for traditional plugins.
			[fields] => Array
				(
					[maintenance.php] => array( data )

					[object-cache.php] => array( data )

				)

		)

	[wp-active-theme] => Array
		(
			[label] => Active Theme
			[fields] => Array
				(
					[name] => array( data )

					[version] => array( data )

					[author] => array( data )

					[author_website] => array( data )

					[parent_theme] => array( data )

					[theme_features] => array( data )

					[theme_path] => array( data )

					[auto_update] => array( data )

				)

		)

	[wp-parent-theme] => Array
		(
			[label] => Parent Theme
			[fields] => Array( data )
		)

	[wp-themes-inactive] => Array
		(
			[label] => Inactive Themes
			[show_count] => 1
			[fields] => Array
				(
					[Dummy] => array( data )

				)

		)

	[wp-mu-plugins] => Array
		(
			[label] => Must Use Plugins
			[show_count] => 1
			[fields] => Array
				(
					[disable-plugins-in-front.php] => array( data )

					[main.php] => array( data )

					[not_support_browsers_redirect.php] => array( data )

					[POMOdoro Translation Cache] => array( data )

					[protect-malicious-queries.php] => array( data )

					[Rus to Lat] => array( data )

				)

		)

	[wp-plugins-active] => Array
		(
			[label] => Active Plugins
			[show_count] => 1
			[fields] => Array
				(
					[AJAX Simply] => array( data )

					[Democracy Poll] => array( data )

					[Disable Emojis (GDPR friendly)] => array( data )

					[Display Active Plugins First] => array( data )

					[Kama Breadcrumbs] => array( data )

					[Kama Postviews] => array( data )

					[Kama SpamBlock] => array( data )

					[Kama Thumbnail Pro] => array( data )

					[Redis Object Cache] => array( data )

				)

		)

	[wp-plugins-inactive] => Array
		(
			[label] => Inactive Plugins
			[show_count] => 1
			[fields] => Array
				(
					[404 Error Monitor] => array( data )

					[Category Order and Taxonomy Terms Order] => array( data )

					[Contact Form 7] => array( data )

					[Kama Thumbnail] => array( data )

					[Query Monitor] => array( data )

					[Query Monitor Extend] => array( data )

					[Right Now Reloaded] => array( data )

					[Three Column Screen Layout] => array( data )

					[TinyPNG - JPEG, PNG & WebP image compression] => array( data )

					[User Role Editor] => array( data )

					[Widget Logic] => array( data )

					[WooCommerce] => array( data )

					[WordPress Sphinx Search Plugin] => array( data )

					[WP Crontrol] => array( data )

					[WP Super Cache] => array( data )

					[Yoast SEO] => array( data )

				)

		)

	[wp-media] => Array
		(
			[label] => Media Handling
			[fields] => Array
				(
					[image_editor] => array( data )

					[imagick_module_version] => array( data )

					[imagemagick_version] => array( data )

					[imagick_version] => array( data )

					[file_uploads] => array( data )

					[post_max_size] => array( data )

					[upload_max_filesize] => array( data )

					[max_effective_size] => array( data )

					[max_file_uploads] => array( data )

					[imagick_limits] => Array ( data )

					[imagemagick_file_formats] => Array( JPEG, JPG, MOV, MP4, MPEG, MPG, PNG, PNG24, WBMP, WEBP, WMV ... )

					[gd_version] => array( data )

					[gd_formats] => array( data )

					[ghostscript_version] => array( data )

				)

		)

	[wp-server] => Array
		(
			[label] => Server
			[description] => The options shown below relate to your server setup. If changes are required, you may need your web host’s assistance.
			[fields] => Array
				(
					[server_architecture] => array( data )

					[httpd_software] => array( data )

					[php_version] => array( data )

					[php_sapi] => array( data )

					[max_input_variables] => array( data )

					[time_limit] => array( data )

					[memory_limit] => array( data )

					[max_input_time] => array( data )

					[upload_max_filesize] => array( data )

					[php_post_max_size] => array( data )

					[curl_version] => array( data )

					[suhosin] => array( data )

					[imagick_availability] => array( data )

					[pretty_permalinks] => array( data )

				)

		)

	[wp-database] => Array
		(
			[label] => Database
			[fields] => Array
				(
					[extension] => array( data )

					[server_version] => array( data )

					[client_version] => array( data )

					[database_user] => array( data )

					[database_host] => array( data )

					[database_name] => array( data )

					[database_prefix] => array( data )

					[database_charset] => array( data )

					[database_collate] => array( data )

				)

		)

	[wp-constants] => Array
		(
			[label] => WordPress Constants
			[description] => These settings alter where and how parts of WordPress are loaded.
			[fields] => Array
				(
					[ABSPATH] => array( data )

					[WP_HOME] => array( data )

					[WP_SITEURL] => array( data )

					[WP_CONTENT_DIR] => array( data )

					[WP_PLUGIN_DIR] => array( data )

					[WP_MEMORY_LIMIT] => array( data )

					[WP_MAX_MEMORY_LIMIT] => array( data )

					[WP_DEBUG] => array( data )

					[WP_DEBUG_DISPLAY] => array( data )

					[WP_DEBUG_LOG] => array( data )

					[SCRIPT_DEBUG] => array( data )

					[WP_CACHE] => array( data )

					[CONCATENATE_SCRIPTS] => array( data )

					[COMPRESS_SCRIPTS] => array( data )

					[COMPRESS_CSS] => array( data )

					[WP_LOCAL_DEV] => array( data )

					[DB_CHARSET] => array( data )

					[DB_COLLATE] => Array
						(
						)

				)

		)

	[wp-filesystem] => Array
		(
			[label] => Filesystem Permissions
			[description] => Shows whether WordPress is able to write to the directories it needs access to.
			[fields] => Array
				(
					[wordpress] => array( data )

					[wp-content] => array( data )

					[uploads] => array( data )

					[plugins] => array( data )

					[themes] => array( data )

					[mu-plugins] => array( data )

				)

		)

)
Плагины для дебага и профилирования в WordPress
В каталоге WP есть несколько хороших плагинов, которые расширяют возможности «дебага» и дают дополнительную информацию для выявления слабых мест кода. Популярные из них:
-
Query Monitor — выводит в подвале кучу полезной информации о текущем запросе. Сколько времени затрачено, сколько SQL запросов, какие запросы, сколько времени занял каждый запрос, сколько памяти затрачено, какие хуки использовались и т.д.
-
Debug Bar — комплекс плагинов по дебагингу и профилированию. Это основной плагин, после его установки к нему можно подключать еще другие плагины, которые расширяют возможности профилирования. Но я его как-то не оценил…
-
Log Deprecated Notices — записывает в лог все заметки о наличии устаревших функций WordPress или их параметров и т.д. Не зависит от WP_DEBUG — работает с отключенным WP_DEBUG.
-
WordPress mu-plugin for debugging — альтернативный дебаггер на базе библиотеки Kint.
- Clockwork для WordPress — выводит любую отладочную информацию в консоль браузера Google Chrome или Firefox, работает на основе браузерного расширения Clockwork, чтобы иметь возможность передавать данные с сервера на клиент. Есть возможность отладки AJAX-запросов.

Written by Steve Burge on August 24, 2022.
Having a code problem with your WordPress site?
There’s a significant chance that the answer can be found in a PHP error log.
Often these error logs are available via hosting company control panels, but also there are many users who can’t access them. In this guide, I’ll show you how to set up PHP error logs for your WordPress site. We recommend the Logtivity platform as this requires very little configuration and it also makes your error logs very easy to read.
Set up access for your WordPress error logs
You will need to create an account at Logtivity to follow along with this guide. There is a 10-day free trial you can use to test the service. This guide shows how to connect your site to Logtivity.
This screenshot below is a preview of error logs in Logtivity. You can see the errors, how often they occur, and when they last occurred. Click here for an explanation of the difference between errors and warnings.

For each PHP error, you can to drill down and see specific details. Logtivity can point you to the file that’s causing problems and give you a stack trace. This screenshot below shows an error from WooCommerce and specifically the WooCommerce Subscriptions plugin. In this error report you can see exactly which line of code in which file is causing the problem. This issue is caused by line #435 in class-wcs-cart-renewal.php.

There’s also a full stack trace available so you can track errors back through your codebase. This screenshot below shows the stack trace for the WooCommerce error above.

Why we recommend Logtivity’s hosted error logs
Hosted error logs have several major advantages over regular error logs from your hosting company:
First, Logtivity error logs are easily and instantly searchable. With many hosting companies, the error logs are dumped into one big, messy file.
Second, you get instant access to logs: Hosting companies often make it difficult to view error logs for WordPress sites. Some hosting companies even require you to contact them to get log access! With Logtivity, you’ll always have instant access to error logs.
Third, you receive notifications: Logtivity notifies you as soon as an error occurs, so can jump in and find the solution as soon as possible. A Fatal Error is an error that takes your WordPress site offline. Logtivity will catch these errors and send you an immediate notification by Slack and Email. This image below shows a Slack notification for a Fatal Error. You can click the “View Error” button to immediately see full details on what’s wrong:

Finally, you can organize the error logs. With Logtivity you can see which errors have been resolved, and which ones still require work from your team. The hosted error logs allow you to mark each issue as “Resolved” or “Unresolved”. There is a filter at the top of the screen so you can see which errors have been fixed, and which ones still need a solution. This helps you keep track of which errors still need your team’s attention.

Диагностика проблем, возникающих на сайте WordPress, может оказаться сложной. Наглядный способ проследить появление ошибок и получить обратную связь – использование журнала логов. Изучение записей в логах позволит выяснить причину проблемы и устранить ее.
Где хранится лог ошибок ВордПресс и как его посмотреть
Первый шаг к исправлению ошибок на сайте – выяснить, при каких обстоятельствах они возникают. Кроме того, периодически могут появляться неявные ошибки и системные предупреждения, о которых вы не знаете, поскольку ваши действия их никогда не вызывали, но посетители сайта могли это заметить.
Чтобы просмотреть ошибки и предупреждения, необходимо записать их в специальный файл журнала. Ведение журнала логов является хорошей практикой, особенно если сайт находится в стадии разработки. Возможно, вам не удастся понять причину ошибки, когда она впервые возникнет, но как только вы получите больше информации при последующей работе, логи в журнале окажутся очень полезными для анализа ситуации.
Фактический журнал логов хранится в файле с именем debug.log в каталоге содержимого вашего сайта wp-content на сервере хостинг-провайдера. Как посмотреть логи? Один из способов просмотра и очистки журнала – прямой доступ к этому файлу. Скачайте файл с помощью файлового менеджера и откройте его любым текстовым редактором. Можно воспользоваться плагинами, которые упрощают работу с логами.
Можно ли удалять логи? Файл с отладочной информацией и уведомлениями об ошибках со временем может разрастись до внушительных размеров. Поэтому, если ваш сайт работает нормально, то старые логи можно удалить, чтобы освободить рабочее пространство.
Как включить/выключить логирование
Чтобы включить создание лог-журнала для сайта на WordPress, понадобится внести изменения в системный файл wp-config.php, который расположен на сервере хостинга.
- Запустите файловый менеджер и подключитесь к удаленному серверу со своей учетной записью, который вам предоставил хостинг-провайдер.
- Перейдите в корневой каталог, где установлен ваш сайт.
- Сделайте резервную копию файла wp-config.php, чтобы восстановить систему после завершения отладки.
Откройте файл wp-config.php на удаленном сервере, вставьте или отредактируйте строки, которые управляют созданием логов:
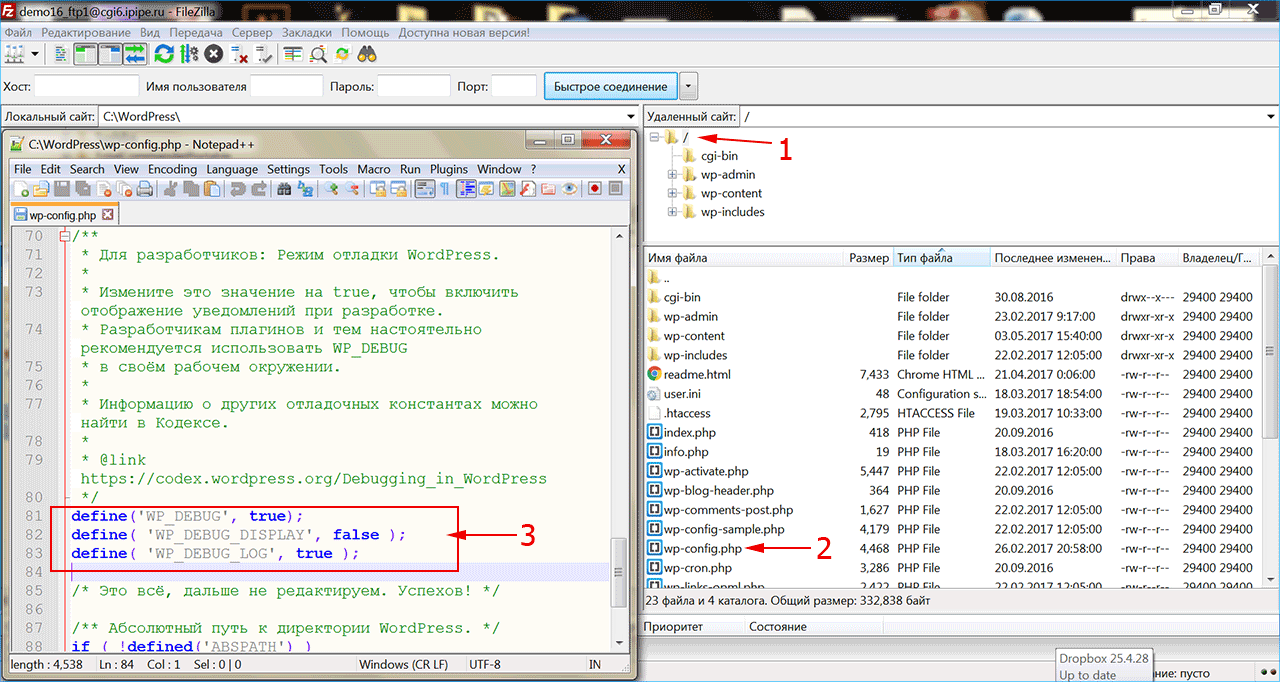
define( 'WP_DEBUG', true );

define( 'WP_DEBUG_DISPLAY', false );

define( 'WP_DEBUG_LOG', true );
Большинство сайтов на WordPress уже имеют запись для константы WP_DEBUG, установленную в значение false, поэтому вам нужно изменить это значение на true. Строка с WP_DEBUG_LOG может отсутствовать, поэтому придется ее добавить, эта команда активирует создание журнала логов для сайта. Константа WP_DEBUG_DISPLAY, установленная в значение false, поможет скрыть запись логов от посетителей сайта. Убедитесь, что каждая константа определена в файле только один раз.
Лог действий в WordPress
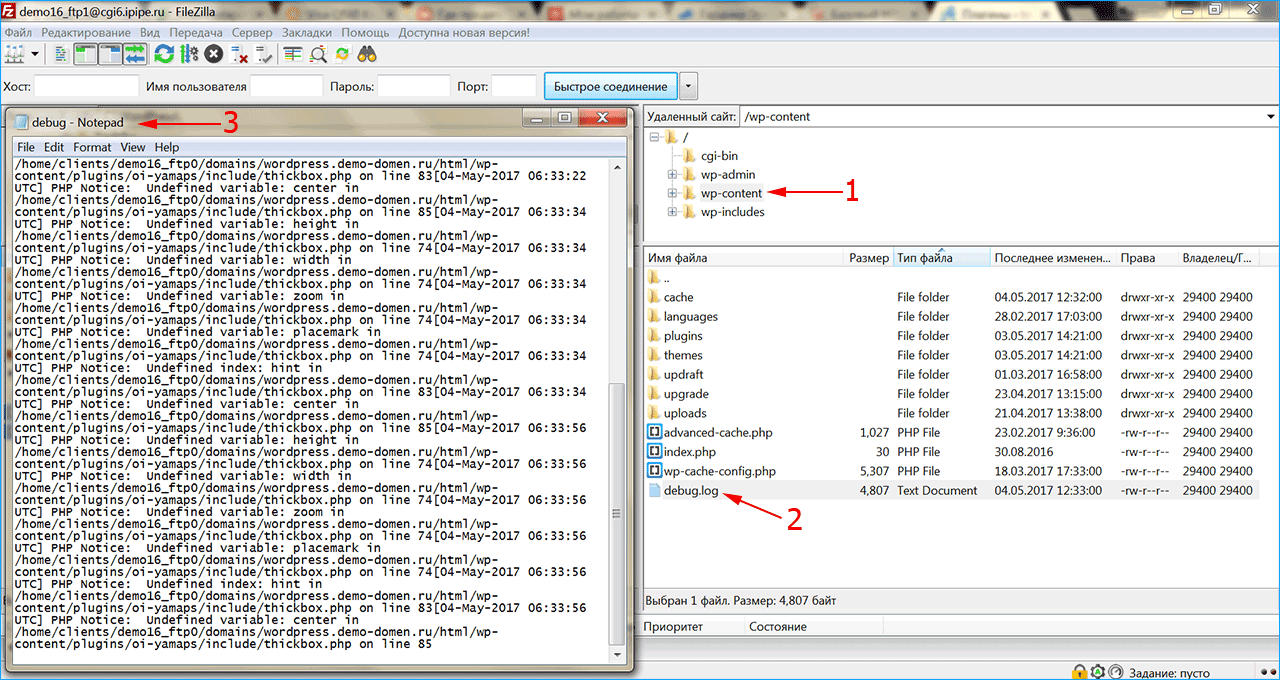
После того как запись логов включена, перейдите в папку содержимого сайта на WordPress. Обычно она называется wp-content, если вы не переименовали ее ранее. Откройте файл журнала debug.log, перейдите в конец и найдите строки с метками времени, соответствующими вашим недавним действиям над сайтом.
Каждый раз, когда возникает предупреждение или ошибка в работе сайта, WordPress генерирует уведомление, которое записывается в журнал логов с отметкой времени в формате UTC. По этим причинам на работающем сайте рекомендуется оставить WP_DEBUG включенным. Устраните выявленные проблемы, при необходимости восстановите оригинальный файл wp-config.php.
Ведение логов на сайте полезно, поскольку позволяет выяснить, какие именно действия вызывают ошибки, какие действия пользователей или администраторов сайта чаще всего провоцируют их возникновение. Кроме того, в логах фиксируется вся информация об изменениях на сайте, что позволяет отслеживать динамику сайта.
Плагины для логирования действий
Разработано несколько специальных плагинов, позволяющих просмотреть журнал логов напрямую из админки WordPress. Вы можете установить их прямо в админпанели в разделе «Плагины»
Activity Log – популярный плагин с большим количеством активных установок. Позволяет записать хронологию действий пользователей, их вход в админку и выход. Будут зафиксированы последние действия со страницами и записями, удаление и установка тем и плагинов.
WP Security Audit Log – плагин для мониторинга действий пользователей в админке сайта. Можно использовать для ведения лог-журнала электронного магазина WooCommerce и отслеживать изменение состояния продукта. Плагин создает предупреждение о безопасности, когда в системе создается новый пользователь, и позволяет отследить подозрительную активность, прежде чем это станет проблемой безопасности.
WP Log Viewer – плагин создает виджет панели администратора и позволяет включить/отключить запись лога одним щелчком мыши, при этом не требуется вручную редактировать файл wp-config.php. Можно выполнить фильтрацию ошибок, очистить журнал, сортировать записи по дате или провести поиск ошибок по времени. Пользовательские ошибки обозначаются разными цветами.
Error Log Monitor – этот плагин добавляет виджет, который видим только для администраторов. Он отображает последние сообщения из журнала логов, а также умеет отправлять уведомления по электронной почте о новых возникших ошибках. Частота уведомлений и количество отображаемых записей в журнале настраивается. Плагин оптимизирован для работы с очень большими лог-файлами.
iPipe – надёжный хостинг-провайдер с опытом работы более 15 лет.
Мы предлагаем:
- Виртуальные серверы с NVMe SSD дисками от 299 руб/мес
- Безлимитный хостинг на SSD дисках от 142 руб/мес
- Выделенные серверы в наличии и под заказ
- Регистрацию доменов в более 350 зонах
Do you need to access the WordPress error logs to troubleshoot a problem on your site?
WordPress comes with a debugging system that can log any error messages displayed on your site. This can help you discover and fix problems on your website.
In this article, we’ll show you how to find and access your WordPress error logs.

How and When Can WordPress Error Logs Help?
Are you having problems with your WordPress website? Checking your WordPress error logs can help you find the source of problems such as slow website performance, plugins that aren’t working properly, and website crashes.
What is an Error Log?
An error log is a list of error messages generated by your website and the dates and times they occurred. Once WordPress debug mode is turned on, these messages are collected in a file, so that you can review them later.
Your WordPress error log is a troubleshooting tool that can help you identify the plugins, themes, or code that are causing problems. You can then go ahead and find a fix for those WordPress errors.
For example, checking the error logs can help troubleshoot errors like the WordPress white screen of death, PHP errors, the invalid JSON error, and the “Sorry, you are not allowed to access this page” error.
That being said, let’s have a look at how to find and access your WordPress error logs. The first step is to enable WordPress debug mode, which you can do using either a plugin or code.
- Enabling WordPress Debug Mode With a Plugin
- Enabling WordPress Debug Mode Using Code
- How to Find and Access WordPress Error Logs
- How to Fix Issues Found in WordPress Error Logs
- Disabling WordPress Debug Mode
Enabling WordPress Debug Mode With a Plugin
WordPress debugging is turned off by default, so WordPress will not be logging any errors. If you can still log into your WordPress site, then you can enable debug mode using a plugin.
The first thing you need to do is install the WP Debugging plugin. For more details, see our step by step guide on how to install a WordPress plugin.

Upon activation, the plugin automatically activates WordPress debug mode, and error messages on your site will now be logged.
Enabling WordPress Debug Mode Using Code
You can also turn on WordPress debug mode using code. This is suitable for more advanced users, or if you can’t log in to your WordPress admin area.
You will need to edit your wp-config.php file using an FTP client or the file manager option in your WordPress hosting control panel.

Once you have the file open, you need to find the text where it says ‘That’s all, stop editing! Happy blogging.’
Just before this line, go ahead and add the following code:
define( 'WP_DEBUG', true );
define( 'WP_DEBUG_LOG', true );
For step by step instructions, see our guide on how to set up WordPress error logs in wp-config with code.
How to Find and Access WordPress Error Logs
Now that you have enabled WordPress debug mode, any future error messages on your website will be stored in the WordPress error logs.
That means that your logs will be empty at first. You will need to try to recreate the problem on your site, so the error messages can be saved to the log file. For example, you should revisit any posts or pages that are causing an error.
Next, you need to connect to your website using an FTP client or the file manager option in your WordPress hosting control panel. If you haven’t used FTP before, then you may want to see our guide on how to use FTP to upload files to WordPress.
Once connected, you should navigate to the /wp-content/ folder. Inside the folder, you will find a file called debug.log. This file contains every WordPress error message, warning, and notice that has been logged.

To see the contents of this file you will need to download, view, or edit it. You can then inspect the error messages along with the date and time they occurred. This information can help you find a solution to the problems you are encountering on your website.

How to Fix Issues Found in WordPress Error Logs
Once you’ve accessed your WordPress error logs, you can find the error message that was logged at the time the problem on your website occurred. Keep in mind that the times displayed are UTC, not your own local time.
While most users won’t understand what the error messages mean, they’re a good place to start troubleshooting. Once you note the error message and code, you may find a solution to your problem in our guide on the 50 most common WordPress errors and how to fix them.
If you can’t find the solution on your own, then you can reach out for help on our free WPBeginner Engage Facebook Group where you can get help from our WordPress experts and over 80,000 users. Make sure you quote the error code or message you found in the WordPress error logs.
Other places you can turn for help are the official WordPress forums, your WordPress web hosting company’s support team, or the designated support area for the plugin or theme you are having trouble with.
When asking for support, check our guide on how to properly ask for WordPress support and get it to learn the right way to ask questions and the best places to find support.
Disabling WordPress Debug Mode
Once you have fixed the issue on your WordPress site, we recommend you disable debug mode. Leaving it on may slow down your website and can potentially leak unwanted information which is a security risk.
If you enabled debug mode with a plugin, then simply navigate to Plugins » Installed Plugins and deactivate the WP Debugging plugin.

If you enabled debug mode with code, then simply edit the wp-config file as you did before.
You need to change the WP_DEBUG and WP_DEBUG_LOG lines to ‘false’.

We hope this tutorial helped you learn how to find and access your WordPress error logs. You may also want to learn how to get a free SSL certificate for your website, or check out our tips on how to speed up WordPress performance.
If you liked this article, then please subscribe to our YouTube Channel for WordPress video tutorials. You can also find us on Twitter and Facebook.
Disclosure: Our content is reader-supported. This means if you click on some of our links, then we may earn a commission. See how WPBeginner is funded, why it matters, and how you can support us.
Editorial Staff at WPBeginner is a team of WordPress experts led by Syed Balkhi. We have been creating WordPress tutorials since 2009, and WPBeginner has become the largest free WordPress resource site in the industry.