Темы
- WP_DEBUG
- PHP ошибки, предупреждения, и заметки
- Устаревшие функции и аргументы
- WP_DEBUG_LOG
- WP_DEBUG_DISPLAY
- SCRIPT_DEBUG
- SAVEQUERIES
- Пример файла wp-config.php для отладки
- Плагины для отладки
- Внешние ссылки
Отладка кода важна для любого проекта. WordPress поставляется с системами отладки, разработанными для упрощения процесса, а также для стандартизации кода в ядре, плагинах и темах. На этой странице описываются различные инструменты отладки в WordPress и способы повышения продуктивности кода, а также повышения его общего качества и функциональности.
Для не программиста или обычного пользователя эти параметры могут использоваться для отображения подробной информации об ошибке.
WP_DEBUG
WP_DEBUG это константа PHP , используемая для установки режима отладки в WordPress. По умолчанию она имеет значение «false», но может быть установлена как «true» в файле конфигурации wp-config.php на сайтах, на которых проводится отладка.
define( 'WP_DEBUG', true );
define( 'WP_DEBUG', false );
Заметка: значения true и false в примере не заключены в кавычки или апострофы, поскольку являются булевыми (правда/ложь) значениями. Не заключайте их в кавычки (например 'false'), иначе они станут восприниматься как строковые значения.
Не рекомендуется включать WP_DEBUG или другие инструменты отладки на рабочих сайтах, отладку рекомендуется производить при локальном тестировании или на разрабатываемых сайтах.
Наверх ↑
PHP ошибки, предупреждения, и заметки
Включение WP_DEBUG приведет к отображению всех ошибок, предупреждений и заметок PHP. Скорее всего это изменит поведение по умолчанию PHP, при котором могут отображаться только фатальные ошибки или белый экран.
Отображение всех уведомлений и предупреждений PHP часто приводит к сообщениям об ошибках для того, что может быть и не сломано, но нарушает надлежащие правила проверки данных в PHP. Эти предупреждения легко исправить разработчикам, если соответствующий код был идентифицирован.
Заметка: Не стоит самостоятельно заниматься исправлением кода ядра, плагинов, тем. Сообщите о проблеме разработчикам соответствующих компонентов, чтобы они внесли исправления в будущих версиях.
Наверх ↑
Устаревшие функции и аргументы
Включение WP_DEBUG также будет вызывать уведомления об устаревших функциях и аргументах в WordPress, которые используются на вашем сайте. Это функции или аргументы функций, которые еще не были удалены из основного кода, но должны быть удалены в ближайшем будущем. Уведомления об устаревании часто указывают на новую функцию, которую следует использовать вместо этого.
Наверх ↑
WP_DEBUG_LOG
WP_DEBUG_LOG это дополнение к WP_DEBUG которое позволяет сохранять ошибки в файл debug.log. Это полезно если вы хотите посмотреть ошибки позже или посмотреть то, что не выводится на экран (например для AJAX запросов или работы wp-cron).
Заметьте, что запись в лог производится внутренней функцией PHP error_log(), она очень удобна для отладки событий AJAX.
При установке в значение true, журнал будет сохраняться как wp-content/debug.log на вашем сайте. Вы можете задать альтернативное имя, для сохранения его в другом месте.
define( 'WP_DEBUG_LOG', true );
-или-
define( 'WP_DEBUG_LOG', '/tmp/wp-errors.log' );
Заметка: Для работы WP_DEBUG_LOG нужно включить WP_DEBUG (true). Вы можете независимо от этого отключить WP_DEBUG_DISPLAY.
Наверх ↑
WP_DEBUG_DISPLAY
WP_DEBUG_DISPLAY это другое дополнение для WP_DEBUG, которое контролирует вывод сообщений отладки в HTML код страницы (на экран). Значение по умолчанию — ‘true’, что позволяет видеть ошибки и предупреждения на экране, в момент их возникновения. Установка значения как false спрячет все ошибки, что можно использовать вместе с WP_DEBUG_LOG, чтобы просмотреть ошибки из файла позже.
define( 'WP_DEBUG_DISPLAY', false );
Заметка: Для работы WP_DEBUG_LOG нужно включить WP_DEBUG (true). Вы можете независимо от этого использовать WP_DEBUG_LOG
Наверх ↑
SCRIPT_DEBUG
SCRIPT_DEBUG это константа, позволяющая использовать версии для разработки CSS и JavaScript файлов ядра, вместо их оптимизированных версий, которые используются по умолчанию. Константа полезна при тестировани изменений в стандартных файлах .js и .css. По умолчанию — false.
define( 'SCRIPT_DEBUG', true );
Наверх ↑
SAVEQUERIES
Определение SAVEQUERIES будет сохранять запросы к СУБД в массив, который можно проанализировать. При определении константы как true, будут сохраняться все запросы, время исполнения, функция вызова запроса.
define( 'SAVEQUERIES', true );
Массив сохраняется в глобальном $wpdb->queries.
Заметка: Это сильно снижает производительность вашего сайта.
Наверх ↑
Пример файла wp-config.php для отладки
Следующий код в файле wp-config.php включит запись всех ошибок, предупреждений и заметок PHP в файл debug.log внутри папки wp-content. Он также отключит вывод на экран (в код страницы):
// Включить отладку WP_DEBUG
define( 'WP_DEBUG', true );

// Включить журнал /wp-content/debug.log
define( 'WP_DEBUG_LOG', true );

// Отключить вывод на экран
define( 'WP_DEBUG_DISPLAY', false );
@ini_set( 'display_errors', 0 );

// Использовать версии JS и CSS для разработчика (при тестировании изменений в них)
define( 'SCRIPT_DEBUG', true );
Заметка: Это нужно вставить перед /* Это всё, дальше не редактируем. Успехов! */ в файл wp-config.php .
Наверх ↑
Плагины для отладки
В каталоге есть много плагинов для отладки WordPress, которые позволяют получить больше информации о работе движка или отдельных компонентов, а также в целом. Например:
- Query Monitor
- Debug Bar
- Log Deprecated Notices
Наверх ↑
Внешние ссылки
- Генератор файла «wp-config.php»
- Плагин «No White Screen»: показывает ошибку вместо белого экрана
В разработке нужно иметь возможность смотреть где ошибка, когда что-то вдруг сломалось. В WordPress для этого есть специальный режим «дебаг» (режим отладки). В этой заметке разберем его на части и посмотрим что это за константа такая WP_DEBUG.
Зачем нужен «дебаг режим»?
Допустим, вы изменили код файла functions.php темы и сайт перестал работать. Вместо него белый экран — ничего не понятно. «дебаг» поможет разобраться, он покажет ошибку и скажет в какой она строке какого файла.
«Дебаг» выводит не только ошибки, из-за которых сайт перестает работать, но и заметки. Заметки могут создаваться самим PHP (например, когда неправильно используется переменная) или кодом PHP скрипта (например, WP создает такие заметки, если сайт использует устаревшую функцию WordPress, или устаревший параметр функции).
Читайте также
-
пример исправления скорости загрузки сайта через профилирование слабых мест с помощью xDebug + phpStorm.
- Profiling WordPress Sites (видео)
Есть два варианта режима «дебаг»:
WP_DEBUG_DISPLAY— Константа показа ошибок на экран.WP_DEBUG_LOG— Константа запись ошибок в лог файл.
Сам «дебаг» режим включается константой WP_DEBUG.
Все три константы могут принимать значения true или false.
По умолчанию константы дебага имеют такие значения:
- WP_DEBUG = false (true при
'development' === wp_get_environment_type()) - WP_DEBUG_DISPLAY = true
- WP_DEBUG_LOG = false
Константы обычно определяются в файле wp-config.php.
wp_initial_constants() определяет дефолтные значения констнат, если они не установлены вручную. Функция срабатывает на раннем этапе загрузки WordPress.
wp_debug_mode() устанавливает настройки PHP на основе установленных констант.
WP_DEBUG_DISPLAY и WP_DEBUG_LOG активируются, только если включена константа WP_DEBUG.
Включение WP_DEBUG не изменяет значение других констант. Т.е. при WP_DEBUG=true WP_DEBUG_DISPLAY и WP_DEBUG_LOG сохранят свои дефолтные значения и на основе этих значений будут выставлены PHP настройки показа и логирования ошибок.
Отображение ошибок форсировано отключено для AJAX/REST/XMLRPC/JSONP запросов. См. код wp_debug_mode():
if (
	defined( 'XMLRPC_REQUEST' )
	|| defined( 'REST_REQUEST' )
	|| defined( 'MS_FILES_REQUEST' )
	|| ( defined( 'WP_INSTALLING' ) && WP_INSTALLING )
	|| wp_doing_ajax()
	|| wp_is_json_request()
) {
	ini_set( 'display_errors', 0 );
}
Как включить показ ошибок в AJAX запросе, сморите в статье про AJAX.
Важно отключать «дебаг» на рабочем сайте.
Как включить «дебаг» (показ ошибок в WordPress)
Базовое включение
Откройте файл wp-config.php в корне сайта и измените false на true в строке:
define( 'WP_DEBUG', true ); // false - отключить показ ошибок
При таком включении ошибки и заметки будут выводиться на экран, но ничего логироваться не будет.
Включение и настройка дебага
Код ниже, включит запись ошибок, предупреждений и заметок в файл wp-content/debug.log и выключит показ заметок и предупреждений на экране, чтобы они не мешались при просмотре сайта.
define( 'WP_DEBUG', true );     // включение дебаг режима
define( 'WP_DEBUG_LOG', true ); // true - логирование ошибок в файл /wp-content/debug.log
define( 'WP_DEBUG_DISPLAY', false ); // false - отключает показ ошибок на экране
define( 'SCRIPT_DEBUG', true ); // используем полные версии JS и CSS файлов движка
Вставлять этот код нужно в файл wp-config.php куда угодно, но до строки:
require_once( ABSPATH . 'wp-settings.php' );
Благодаря коду выше, было включено логирование ошибок в файл. Этим можно воспользоваться для записи содержимого переменных в этот файл:
error_log( $value );               // Скалярные величины
error_log( print_r( $value, 1) );  // Любые данные
Динамическое включение показа ошибок
Этот код помогает быстро включать константу WP_DEBUG, которая на рабочем сайте должна быть выключена. Также код позволяет включить запись ошибок в файл debug.log в папку /wp-content и отключить показ ошибок на экране.
Зачем это надо? Допустим, мы сделали сайт и на боевом сайте нам иногда нужно видеть ошибки (обычно конечно все это тестируется на локалке, но всякое бывает нужно). Чтобы видеть причину ошибки, нам нужно включить дебаг, но на боевом сайте где ходят пользователи делать этого не рекомендуется. С помощью кода ниже можно включить дебаг режим в WordPress через URL, зная определенный ключ.
Включение ошибок сохраняется в куку.
Установка
Замените строку define( WP_DEBUG, false ); в файле wp-config.php на такой код:
GitHub
<?php

/**
 * Dynamically enable/disable the display of PHP errors in WordPress.
 *
 * Installation:
 * replace line 'define( WP_DEBUG, false );' in 'wp-config.php' file with this code.
 *
 * Enabling debug mode:
 * NOTE: Strongly recommended to changing the 'debug' word to something more unique!
 * add the 'debug' query parameter to the URL. Examples:
 * https://site.com/?debug - default enabling of WP_DEBUG constant
 * https://site.com/?debug=1 - logging of errors into file 'DOCUMENT_ROOT/../php-errors-{HOST}.log'.
 * https://site.com/?debug=2 - linking uncompressed scripts and saving all SQL queries to $wpdb->queries
 * https://site.com/?debug=3 - saving all SQL queries in $wpdb->queries
 * https://site.com/?debug=4 - disable displaying errors (enabled by default)
 * https://site.com/?debug=14 - combining
 *
 * Disabling debug mode:
 * https://site.com/?debug=anything
 *
 * @author Kama (http://wp-kama.ru)
 * ver 2.5
 */
// IMPORTANT: change from `debug` to your unique key!
kama_define_wp_debug( 'debug' );

function kama_define_wp_debug( $key ){

	$val = isset( $_GET[ $key ] ) ? ( $_GET[ $key ] ?: 'yes' ) : false;

	// set/delete cookie
	if( $val !== false ){

		$cookie = preg_match( '/^(yes|[1234])$/', $val ) ? $val : null;

		$host = str_replace( 'www.', '', $_SERVER['HTTP_HOST'] );

		// cirilic domains: .сайт, .онлайн, .дети, .ком, .орг, .рус, .укр, .москва, .испытание, .бг
		false !== strpos( $host, 'xn--' )
			? preg_match( '~xn--[^.]+.xn--[^.]+$~', $host, $mm )
			: preg_match( '~[a-z0-9][a-z0-9-]{1,63}.[a-z.]{2,6}$~', $host, $mm );

		$host = $mm[0];

		$_COOKIE[ $key ] = $cookie;
		setcookie( $key, $cookie, time() + ( $cookie ? 3600 * 24 * 365 : -3600 ), '/', ".$host" );
	}

	// enable the debug based on the cookie
	if( ! empty( $_COOKIE[ $key ] ) ){

		define( 'WP_DEBUG', true );

		$set = array_flip(
			preg_split( '/(d)/', $_COOKIE[ $key ], -1, PREG_SPLIT_DELIM_CAPTURE | PREG_SPLIT_NO_EMPTY )
		);

		isset( $set[1] ) && define( 'WP_DEBUG_LOG', dirname( $_SERVER['DOCUMENT_ROOT'] ) . "/php-errors-{$_SERVER['HTTP_HOST']}.log" );
		isset( $set[2] ) && define( 'SCRIPT_DEBUG', true );
		isset( $set[3] ) && define( 'SAVEQUERIES', true );
		isset( $set[4] ) && define( 'WP_DEBUG_DISPLAY', false );
	}
	else {
		define( 'WP_DEBUG', false );
	}
}
Теперь, чтобы включить режим WP_DEBUG, нужно добавить в любой URL сайта параметр запроса debug: http://example.com/?debug или http://example.com/?debug=1 (принудительный вывод на экран, если такой вывод отключен) или http://example.com/?debug=2 (логирование в файл).
Для защиты, ключ debug нужно изменить на свой, который будете знать только вы, потому что по нему вы будете включить/отключать дебаг режим.
При включении логирования, не забывайте удалять лог файл, а то его может посмотреть кто угодно. Или путь до файла лога можно изменить см. описание WP_DEBUG_LOG.
WP_DEBUG
WP_DEBUG — это PHP константа (глобальная постоянная — определяется всего один раз). Значение этой постоянной включает или отключает показ ошибок в PHP, а также она используется в разных местах кода WordPress для показа или подавления ошибок, где это необходимо.
WP_DEBUG нужно определять (устанавливать) в файле wp-config.php из корня сайта.
define( 'WP_DEBUG', false ); // дебаг отключен. По умолчанию.
// или
define( 'WP_DEBUG', true ); // дебаг включен
Для удобности, можно писать числа 1 или 0:
define( 'WP_DEBUG', 0 ); // дебаг отключен. По умолчанию.
// или
define( 'WP_DEBUG', 1 ); // дебаг включен
Заметка: нельзя указывать false в кавычках — ‘false’. В этом случае дебаг будет включен, потому что значение равно строке false, а не логическому — нет.
PHP ошибки, предупреждения и заметки (errors, warnings и notices)
В PHP есть разные уровни ошибок. Если не вдаваться в подробности, то уровни значимости такие:
errors— серьезная ошибка, которая приводит к остановке скрипта. PHP прерывает работу.warnings— не ошибка, а предупреждение о чем-либо. PHP не прерывает работу.notices— не ошибка, а заметка о чем-либо. PHP не прерывает работу. Заметки могут показать возможные баги в коде. Их исправление, как правило, делает код более стабильным.
«Режим дебаг» включает все уровни ошибок. Это не похоже на обычное поведение PHP, там обычно включены только ошибки уровня errors, а warnings и notices не отображаются. Подробнее читайте в описании error_reporting().
Устаревшие функции, хуки и устаревшие параметры функций
WP_DEBUG также включает внутренние заметки самого WordPress. В WordPress есть специальные функции вроде _deprecated_function(), которые показывают ошибку уровня notices, когда используется устаревшая функция или хук или параметр хука, функции и т.д. Эти заметки предупреждают, что функция WP считается устаревшей и её нужно заменить, потому что она в любой момент может быть удалена. В таких заметках чаще всего предлагается альтернативная функция для замены.

WP_DEBUG_DISPLAY
По умолчанию: true.
Еще один компонент WP_DEBUG, который контролирует вывод (показ) ошибок на экран.
Зависит от WP_DEBUG! Работает только, если дебаг включен WP_DEBUG = true . В противном случае просто используется глобальное значение PHP опции display_errors.
Если указать в wp-config.php:
define( 'WP_DEBUG_DISPLAY', true )— (по умолчанию) WP будет выводить (показывать) ошибки на экран.define( 'WP_DEBUG_DISPLAY', false )— ошибки не будут выводиться на экран. Это нужно, когда ошибки записываются в файл (см. WP_DEBUG_LOG) и их можно смотреть позднее.define( 'WP_DEBUG_DISPLAY', null )— WP вообще не будет указывать значение для PHP опции display_errors, т.е. будет использована глобальная настройка PHP (сервера).
Показ ошибок всегда отключается для REST, AJAX или XML-RPC запросов. Для них срабатывает такой код ini_set( ‘display_errors’, 0 ), но при этом значение константы WP_DEBUG_DISPLAY не изменяется!
WP_DEBUG_LOG
По умолчанию: false
Еще один компонент дебага. Включает запись ошибок в файл /wp-content/debug.log. Зависит от WP_DEBUG — работает только если WP_DEBUG равен true.
Запись ошибок в файл может пригодится, когда нужно проверить наличие ошибок в коде, который ничего не выводит на экран. Например, при AJAX запросе или при тестировании CRON или REST.
define( 'WP_DEBUG_LOG', true ); // true - запись ошибок в файл /wp-content/debug.log
Изменение адреса файла лога ошибок
Через WP
C WordPress 5.1, в WP_DEBUG_LOG можно указать путь к файлу лога:
define( 'WP_DEBUG_LOG', '/srv/path/to/custom/log/location/errors.log' );
Через PHP
Чтобы изменить название файла, добавьте следующую строку как можно раньше, например в MU плагины:
ini_set( 'error_log', WP_CONTENT_DIR . '/hidden-debug.log' );
Но эту строку нельзя добавлять в wp-config.php — это слишком рано…
Имейте ввиду:
- Конечная папка в указанном пути должна существовать и быть доступна для записи.
- Файла внутри может не быть, он будет создан, как только произойдет первая ошибка.
SAVEQUERIES
По умолчанию: не определена.
Связанная с дебагом константана. При включении, все SQL запросы будут сохраняться в переменную $wpdb->queries в виде массива. В этом массиве можно будет посмотреть все SQL запросы и при необходимости найти нужный и убедиться что он правильный и т.п.
Кроме самого запроса, также записываются данные о том сколько времени занял запрос и какой функцией он был вызван.
define( 'SAVEQUERIES', true ); // true - сохраняет SQL запросы и данные о них в `$wpdb->queries`
Важно! что включение записи запросов, требует дополнительной памяти и PHP операций. Поэтому, в целях производительности, на рабочем сайте эта константа должна быть отключена.
SCRIPT_DEBUG
По умолчанию: false.
Связанная с дебагом константа. Контролирует какие JS и CSS файлы использовать: сжатые или полные. При включении WordPress будет использовать не сжатые версии (dev версии) JS и CSS файлов. По умолчанию используются min версии файлов. Это нужно для тестирования при изменении встроенных js или css файлов.
define( 'SCRIPT_DEBUG', true ); // true - использование полных версий `.css` и `.js` файлов
Как работает WP_DEBUG?
После установки констант дебага в wp-config.php мы заходим на сайт. И при генерации страницы, в самом начале загрузки WordPress (см. wp-settings.php) срабатывает функция wp_debug_mode(). Она, используя функции PHP, устанавливает как и какие уровни ошибок показывать, нужно ли создавать лог файл и т.д.
Не работает WP_DEBUG?
Иногда может возникнуть такая ситуация, когда вы включаете WP_DEBUG в конфиге, а ошибки все равно не видно. Такое поведение может возникнуть, когда где-то после установок параметров показа ошибок самим WordPress эти установки меняются. Например в MU плагине, обычном плагине или в теме, ошибки выключаются переустановкой ini директив PHP, примерно таким кодом:
error_reporting(0); // отключает сообщения об ошибках
ini_set('display_errors', 0); // отключает показ ошибок на экран
В этом случает установки дебага WP перебиваются и он перестает работать…
Для решения, лучше всего найти где изменяются настройки и удалить такие строки, чтобы дальше работать только с константой WP_DEBUG.
В качестве другого решения можно попробовать еще раз перебить настройки вывода ошибок, указав их снова:
error_reporting(E_ALL); // включаем сообщения об ошибках
ini_set('display_errors', 1); // включаем показ ошибок на экран
Функции WP для дебага
- wp_debug_backtrace_summary() — Получает трассировку с названиями функций — список названий всех функций/методов, которые были вызваны для того, чтобы добраться до текущего места в коде (откуда была вызвана эта функция).
- wp_get_environment_type() — Получает текущий тип окружения: local, development, staging, production (по умолчанию).
Данные системы
Для дебага в WP есть класс WP_Debug_Data. Например, используя следующий метод мы можем получить кучу данных о системе:
require_once ABSPATH . '/wp-admin/includes/class-wp-debug-data.php';
require_once ABSPATH . '/wp-admin/includes/update.php';
require_once ABSPATH . '/wp-admin/includes/misc.php';

$data = WP_Debug_Data::debug_data();

print_r( $data );
Получим большой массив данных:
Array
(
	[wp-core] => Array
		(
			[label] => WordPress
			[fields] => Array
				(
					[version] => array( data )

					[site_language] => array( data )

					[user_language] => array( data )

					[timezone] => array( data )

					[home_url] => array( data )

					[site_url] => array( data )

					[permalink] => array( data )

					[https_status] => array( data )

					[multisite] => array( data )

					[user_registration] => array( data )

					[blog_public] => array( data )

					[default_comment_status] => array( data )

					[environment_type] => array( data )

					[user_count] => array( data )

					[dotorg_communication] => array( data )

				)

		)

	[wp-paths-sizes] => Array
		(
			[label] => Directories and Sizes
			[fields] => Array
				(
					[wordpress_path] => array( data )

					[wordpress_size] => array( data )

					[uploads_path] => array( data )

					[uploads_size] => array( data )

					[themes_path] => array( data )

					[themes_size] => array( data )

					[plugins_path] => array( data )

					[plugins_size] => array( data )

					[database_size] => array( data )

					[total_size] => array( data )

				)

		)

	[wp-dropins] => Array
		(
			[label] => Drop-ins
			[show_count] => 1
			[description] => Drop-ins are single files, found in the /public_html/assets directory, that replace or enhance WordPress features in ways that are not possible for traditional plugins.
			[fields] => Array
				(
					[maintenance.php] => array( data )

					[object-cache.php] => array( data )

				)

		)

	[wp-active-theme] => Array
		(
			[label] => Active Theme
			[fields] => Array
				(
					[name] => array( data )

					[version] => array( data )

					[author] => array( data )

					[author_website] => array( data )

					[parent_theme] => array( data )

					[theme_features] => array( data )

					[theme_path] => array( data )

					[auto_update] => array( data )

				)

		)

	[wp-parent-theme] => Array
		(
			[label] => Parent Theme
			[fields] => Array( data )
		)

	[wp-themes-inactive] => Array
		(
			[label] => Inactive Themes
			[show_count] => 1
			[fields] => Array
				(
					[Dummy] => array( data )

				)

		)

	[wp-mu-plugins] => Array
		(
			[label] => Must Use Plugins
			[show_count] => 1
			[fields] => Array
				(
					[disable-plugins-in-front.php] => array( data )

					[main.php] => array( data )

					[not_support_browsers_redirect.php] => array( data )

					[POMOdoro Translation Cache] => array( data )

					[protect-malicious-queries.php] => array( data )

					[Rus to Lat] => array( data )

				)

		)

	[wp-plugins-active] => Array
		(
			[label] => Active Plugins
			[show_count] => 1
			[fields] => Array
				(
					[AJAX Simply] => array( data )

					[Democracy Poll] => array( data )

					[Disable Emojis (GDPR friendly)] => array( data )

					[Display Active Plugins First] => array( data )

					[Kama Breadcrumbs] => array( data )

					[Kama Postviews] => array( data )

					[Kama SpamBlock] => array( data )

					[Kama Thumbnail Pro] => array( data )

					[Redis Object Cache] => array( data )

				)

		)

	[wp-plugins-inactive] => Array
		(
			[label] => Inactive Plugins
			[show_count] => 1
			[fields] => Array
				(
					[404 Error Monitor] => array( data )

					[Category Order and Taxonomy Terms Order] => array( data )

					[Contact Form 7] => array( data )

					[Kama Thumbnail] => array( data )

					[Query Monitor] => array( data )

					[Query Monitor Extend] => array( data )

					[Right Now Reloaded] => array( data )

					[Three Column Screen Layout] => array( data )

					[TinyPNG - JPEG, PNG & WebP image compression] => array( data )

					[User Role Editor] => array( data )

					[Widget Logic] => array( data )

					[WooCommerce] => array( data )

					[WordPress Sphinx Search Plugin] => array( data )

					[WP Crontrol] => array( data )

					[WP Super Cache] => array( data )

					[Yoast SEO] => array( data )

				)

		)

	[wp-media] => Array
		(
			[label] => Media Handling
			[fields] => Array
				(
					[image_editor] => array( data )

					[imagick_module_version] => array( data )

					[imagemagick_version] => array( data )

					[imagick_version] => array( data )

					[file_uploads] => array( data )

					[post_max_size] => array( data )

					[upload_max_filesize] => array( data )

					[max_effective_size] => array( data )

					[max_file_uploads] => array( data )

					[imagick_limits] => Array ( data )

					[imagemagick_file_formats] => Array( JPEG, JPG, MOV, MP4, MPEG, MPG, PNG, PNG24, WBMP, WEBP, WMV ... )

					[gd_version] => array( data )

					[gd_formats] => array( data )

					[ghostscript_version] => array( data )

				)

		)

	[wp-server] => Array
		(
			[label] => Server
			[description] => The options shown below relate to your server setup. If changes are required, you may need your web host’s assistance.
			[fields] => Array
				(
					[server_architecture] => array( data )

					[httpd_software] => array( data )

					[php_version] => array( data )

					[php_sapi] => array( data )

					[max_input_variables] => array( data )

					[time_limit] => array( data )

					[memory_limit] => array( data )

					[max_input_time] => array( data )

					[upload_max_filesize] => array( data )

					[php_post_max_size] => array( data )

					[curl_version] => array( data )

					[suhosin] => array( data )

					[imagick_availability] => array( data )

					[pretty_permalinks] => array( data )

				)

		)

	[wp-database] => Array
		(
			[label] => Database
			[fields] => Array
				(
					[extension] => array( data )

					[server_version] => array( data )

					[client_version] => array( data )

					[database_user] => array( data )

					[database_host] => array( data )

					[database_name] => array( data )

					[database_prefix] => array( data )

					[database_charset] => array( data )

					[database_collate] => array( data )

				)

		)

	[wp-constants] => Array
		(
			[label] => WordPress Constants
			[description] => These settings alter where and how parts of WordPress are loaded.
			[fields] => Array
				(
					[ABSPATH] => array( data )

					[WP_HOME] => array( data )

					[WP_SITEURL] => array( data )

					[WP_CONTENT_DIR] => array( data )

					[WP_PLUGIN_DIR] => array( data )

					[WP_MEMORY_LIMIT] => array( data )

					[WP_MAX_MEMORY_LIMIT] => array( data )

					[WP_DEBUG] => array( data )

					[WP_DEBUG_DISPLAY] => array( data )

					[WP_DEBUG_LOG] => array( data )

					[SCRIPT_DEBUG] => array( data )

					[WP_CACHE] => array( data )

					[CONCATENATE_SCRIPTS] => array( data )

					[COMPRESS_SCRIPTS] => array( data )

					[COMPRESS_CSS] => array( data )

					[WP_LOCAL_DEV] => array( data )

					[DB_CHARSET] => array( data )

					[DB_COLLATE] => Array
						(
						)

				)

		)

	[wp-filesystem] => Array
		(
			[label] => Filesystem Permissions
			[description] => Shows whether WordPress is able to write to the directories it needs access to.
			[fields] => Array
				(
					[wordpress] => array( data )

					[wp-content] => array( data )

					[uploads] => array( data )

					[plugins] => array( data )

					[themes] => array( data )

					[mu-plugins] => array( data )

				)

		)

)
Плагины для дебага и профилирования в WordPress
В каталоге WP есть несколько хороших плагинов, которые расширяют возможности «дебага» и дают дополнительную информацию для выявления слабых мест кода. Популярные из них:
-
Query Monitor — выводит в подвале кучу полезной информации о текущем запросе. Сколько времени затрачено, сколько SQL запросов, какие запросы, сколько времени занял каждый запрос, сколько памяти затрачено, какие хуки использовались и т.д.
-
Debug Bar — комплекс плагинов по дебагингу и профилированию. Это основной плагин, после его установки к нему можно подключать еще другие плагины, которые расширяют возможности профилирования. Но я его как-то не оценил…
-
Log Deprecated Notices — записывает в лог все заметки о наличии устаревших функций WordPress или их параметров и т.д. Не зависит от WP_DEBUG — работает с отключенным WP_DEBUG.
-
WordPress mu-plugin for debugging — альтернативный дебаггер на базе библиотеки Kint.
- Clockwork для WordPress — выводит любую отладочную информацию в консоль браузера Google Chrome или Firefox, работает на основе браузерного расширения Clockwork, чтобы иметь возможность передавать данные с сервера на клиент. Есть возможность отладки AJAX-запросов.
In development, you need to be able to see where the error is when something suddenly breaks. WordPress has a special debug mode for this. In this post, let’s take it apart and see what this WP_DEBUG constant is.
Why do we need «debug mode»?
Let’s say you changed the functions.php file of the theme and the site stopped working. In its place is a white screen — nothing is clear. «Debug» will help to understand, it will show you the error and tell you in which line of what file it is.
«Debug» displays not only the errors that cause the site to stop working, but also the notes and warnings. Notes can be created by PHP itself (for example, when a variable is used incorrectly) or by PHP script code (for example, WP creates such notes if the site uses a deprecated WordPress function, or an deprecated function parameter).
There are two options for debug mode:
WP_DEBUG_DISPLAY— Display errors on the screeen.WP_DEBUG_LOG— Write errors to log file.
The debug mode itself is controlled by WP_DEBUG constant.
All three constants can take true or false values.
By default, the debug constants have these values:
- WP_DEBUG = false (true when
'development' === wp_get_environment_type()) - WP_DEBUG_DISPLAY = true
- WP_DEBUG_LOG = false
All constants can be defined in the wp-config.php file or defined by wp_initial_constants(), which is triggered early on WordPress loading.
WP_DEBUG_DISPLAY and WP_DEBUG_LOG are activated only if the WP_DEBUG constant is enabled.
Enabling WP_DEBUG does not change the value of the other constants. That is, with WP_DEBUG=true WP_DEBUG_DISPLAY and WP_DEBUG_LOG will retain their default values and PHP display and error logging settings will be based on those values.
The wp_debug_mode() function sets the PHP settings based on the values of those constants.
Error display is always disabled for AJAX requests, you can only see errors there through the log file. This is set in wp_debug_mode():
if ( defined( 'XMLRPC_REQUEST' ) || defined( 'REST_REQUEST' ) || ( defined( 'WP_INSTALLING' ) && WP_INSTALLING ) || wp_doing_ajax() ) {
	@ini_set( 'display_errors', 0 );
}
How to enable error display in an AJAX request, see article about AJAX.
It is important to disable «debugging» on the working (production) site.
How to enable «debug» (display errors in WordPress)
Basic enabling
Open the wp-config.php file at the root of your site and change false to true on the line:
define( `WP_DEBUG`, true ); // false - turn off error display
With this option errors and noties will be displayed, but nothing will be logged in log file.
Enable and configure debugging
The code below, will enable the recording of errors, warnings and noties in the wp-content/debug.log file and disable the display of notes and warnings on the screen, so they do not get in the way when browsing the site.
define( 'WP_DEBUG', true );          // enable debug mode
define( 'WP_DEBUG_LOG', true );      // true - logging errors into /wp-content/debug.log file
define( 'WP_DEBUG_DISPLAY', false ); // false - turns off displaying errors on the screen
define( 'SCRIPT_DEBUG', true );      // use full versions of JS and CSS engine files
Insert this code anywhere in the wp-config.php file, but before the line:
require_once( ABSPATH . 'wp-settings.php' );
Thanks to the code above, error logging to a file has been enabled. This can be used to write the contents of the variables to log file:
error_log( $value );               // Scalar values
error_log( print_r( $value, 1) );  // Any data
Dynamically turn on/off errors display
This code helps to quickly enable the WP_DEBUG constant, which on a working site should be turned off. The code also allows you to enable error logging in the /wp-content/debug.log file, and disable error display on the screen.
Why this code is handy? Let’s say we made the site and it works, but we periodically fix it’s code. While editing of course appear different errors, including fatal ones. To see what the cause, we need to enable debug, to do this, open wp-config.php and change the constant, after completion it is necessary to return everything back. This is inconvenient, it’s more convenient to enable debug via URL and see errors when needed.
Enabling errors is saved in the cookie of your site so it will works only for you.
To get things working, replace line define( WP_DEBUG, false ); in file wp-config.php with this code:
GitHub
<?php

/**
 * Dynamically enable/disable the display of PHP errors in WordPress.
 *
 * Installation:
 * replace line 'define( WP_DEBUG, false );' in 'wp-config.php' file with this code.
 *
 * Enabling debug mode:
 * NOTE: Strongly recommended to changing the 'debug' word to something more unique!
 * add the 'debug' query parameter to the URL. Examples:
 * https://site.com/?debug - default enabling of WP_DEBUG constant
 * https://site.com/?debug=1 - logging of errors into file 'DOCUMENT_ROOT/../php-errors-{HOST}.log'.
 * https://site.com/?debug=2 - linking uncompressed scripts and saving all SQL queries to $wpdb->queries
 * https://site.com/?debug=3 - saving all SQL queries in $wpdb->queries
 * https://site.com/?debug=4 - disable displaying errors (enabled by default)
 * https://site.com/?debug=14 - combining
 *
 * Disabling debug mode:
 * https://site.com/?debug=anything
 *
 * @author Kama (http://wp-kama.ru)
 * ver 2.5
 */
// IMPORTANT: change from `debug` to your unique key!
kama_define_wp_debug( 'debug' );

function kama_define_wp_debug( $key ){

	$val = isset( $_GET[ $key ] ) ? ( $_GET[ $key ] ?: 'yes' ) : false;

	// set/delete cookie
	if( $val !== false ){

		$cookie = preg_match( '/^(yes|[1234])$/', $val ) ? $val : null;

		$host = str_replace( 'www.', '', $_SERVER['HTTP_HOST'] );

		// cirilic domains: .сайт, .онлайн, .дети, .ком, .орг, .рус, .укр, .москва, .испытание, .бг
		false !== strpos( $host, 'xn--' )
			? preg_match( '~xn--[^.]+.xn--[^.]+$~', $host, $mm )
			: preg_match( '~[a-z0-9][a-z0-9-]{1,63}.[a-z.]{2,6}$~', $host, $mm );

		$host = $mm[0];

		$_COOKIE[ $key ] = $cookie;
		setcookie( $key, $cookie, time() + ( $cookie ? 3600 * 24 * 365 : -3600 ), '/', ".$host" );
	}

	// enable the debug based on the cookie
	if( ! empty( $_COOKIE[ $key ] ) ){

		define( 'WP_DEBUG', true );

		$set = array_flip(
			preg_split( '/(d)/', $_COOKIE[ $key ], -1, PREG_SPLIT_DELIM_CAPTURE | PREG_SPLIT_NO_EMPTY )
		);

		isset( $set[1] ) && define( 'WP_DEBUG_LOG', dirname( $_SERVER['DOCUMENT_ROOT'] ) . "/php-errors-{$_SERVER['HTTP_HOST']}.log" );
		isset( $set[2] ) && define( 'SCRIPT_DEBUG', true );
		isset( $set[3] ) && define( 'SAVEQUERIES', true );
		isset( $set[4] ) && define( 'WP_DEBUG_DISPLAY', false );
	}
	else {
		define( 'WP_DEBUG', false );
	}
}
Now, to enable WP_DEBUG mode, you need to add ?debugquery parameter to any URL, for example:
http://example.com/?debug— enables debug.http://example.com/?debug=1— forced output to screen if such output is disabled.http://example.com/?debug=2— logging to file.
For security reason, strongly recommended change the ?debug parameter, specify something rare and known only to you.
When enabling error logging (?debug=2) the site parent folder (DOCUMENT_ROOT/..) must be writable, otherwise PHP will not be able to create the log file. Or you can manually create a log file DOCUMENT_ROOT/../php-errors-example.com.log. It must have write permissions (CHMOD 660 or higher).
WP_DEBUG
WP_DEBUG — is a PHP constant (a global constant — only defined once). The value of this constant enables or disables error display in PHP. It is also used in various places in WordPress code to show or suppress errors where necessary.
WP_DEBUG should be defined in the wp-config.php file.
// disable debug (default)
define( 'WP_DEBUG', false );
// or
define( 'WP_DEBUG', 0 );

// enable debug
define( 'WP_DEBUG', true );
// or
define( 'WP_DEBUG', 1 );
Note: do not set false in quotes — 'false'. In this case the debug will be enabled because the value of string ‘false’ is logical true.
PHP errors, warnings and notices
There are different levels of errors in PHP. Without going into details, the significance levels are:
errors— a serious error which leads to a halt of the script. Aborts PHP.warnings— not an error, but a warning about something. PHP does not interrupt.notices— not an error, but a note about something. PHP does not interrupt. Notes may indicate possible bugs in the code. Fixing them will usually make the code more stable.
«Debug mode» includes all levels of errors. This is not like PHP’s usual behavior: usually only errors at the ‘errors’ level are included, and warnings and notices are not shown. See error_reporting() for more details.
Deprecated functions, hooks and deprecated function parameters
WP_DEBUG also includes internal WordPress noties. WordPress has special functions like _deprecated_function(), which show a notices level error when an deprecated function or hook or parameter of a hook, function, etc. is used. These notices warn that the WP function is considered deprecated and should be replaced because it can be removed at any time. Such notes most often suggest an alternative function to replace it.

WP_DEBUG_DISPLAY
Default: true.
Another WP_DEBUG component, which controls the display of errors.
IMPORTANT: it depends on WP_DEBUG — the logic of this parameter works only if WP_DEBUG = true. Otherwise, the global PHP option display_errors is used as the value of WP_DEBUG_DISPLAY.
If you specify in wp-config.php:
-
define( 'WP_DEBUG_DISPLAY', true )— (by default) WP will display errors. -
define( 'WP_DEBUG_DISPLAY', false )— The errors will not be displayed. This is needed when errors are written to a log file (see WP_DEBUG_LOG) and you can see them later. define( 'WP_DEBUG_DISPLAY', null )— WP will not specify a value for PHP option display_errors at all, i.e. it will use the global PHP (server) setting.
Error display is always turned off for REST, AJAX or XML-RPC requests. Such code ini_set(‘display_errors’, 0 ) works for those requests forcibly. The value of WP_DEBUG_DISPLAY constant does not change!
WP_DEBUG_LOG
Default: false.
Another debug component. Enables error logging to file /wp-content/debug.log. Depends on WP_DEBUG — works only if WP_DEBUG = true.
Writing errors in the log file can be useful when you want catch errors, which does not display anything on the screen. For example, when AJAX request or when testing CRON or REST.
«php
define( ‘WP_DEBUG_LOG’, true ); // true — log errors to /wp-content/debug.log
#### Changing the address of the error log file

##### Via WP

Since WordPress 5.1, in ``WP_DEBUG_LOG`` you can specify the log file path:

```php
define( 'WP_DEBUG_LOG', '/srv/path/to/custom/log/location/errors.log' );
Via PHP
To change the file name, add the following line as early as possible, such as in MU plugins:
ini_set( 'error_log', WP_CONTENT_DIR . '/hidden-debug.log' );
This line cannot be added to wp-config.php — it’s too early!
- The end folder in the specified path must exist and be writable.
- The file inside may not exist, it will be created as soon as the first error occurs.
SAVEQUERIES
Default: undefined.
Related to debug constant. When enabled, all SQL queries will be saved in the $wpdb->queries property as an array. In this array you can see all SQL queries and if necessary find the right one and make sure it is correct, etc.
In addition to the query itself, also recorded data about how much time the query took and what function it was called.
// save SQL queries and their data in `$wpdb->queries`
define( 'SAVEQUERIES', true );
Important! this option requires additional memory and PHP operations. Therefore, for performance reasons, this constant should be used only while site development.
SCRIPT_DEBUG
Default: false.
A debug-related constant. Controls which JS and CSS files to use: compressed or full. When enabled, WordPress will use uncompressed versions (dev versions) of JS and CSS files. The default is to use min versions of the files. This is necessary for testing when modifying embedded js or css files.
// use full versions of WP `.css` and `.js` files
define( 'SCRIPT_DEBUG', true );
How does WP_DEBUG work?
After setting the debug constants in wp-config.php we go to the site. And when generating the page, at the very beginning of WordPress loading — see wp-settings.php — wp_debug_mode() function is triggered. It uses PHP functions to set how and what error levels to show, whether or not to create a log file, etc.
WP_DEBUG does not work?
Sometimes you may have a situation when you enable WP_DEBUG in wp-config, but the error is still not visible. This behavior can occur when somewhere after the error display settings by WordPress itself, these settings are changed. For example in MU plugin, a regular plugin or in the theme, the errors are turned off by reinstalling the ini directives PHP, something like this code:
error_reporting( 0 ); // turn off error messages
ini_set( 'display_errors', 0 ); // disables displaying errors
In this case WP’s debug settings get interrupted and it stops working.
To solve this, it is best to find where the settings are changed and delete such lines, so that from now on you can work only with WP_DEBUG constant.
As another solution, you can try to re-build the error output settings by specifying them again:
error_reporting( E_ALL ); // enable error messages
ini_set( 'display_errors', 1 ); // show errors on the screen
WP functions for debugging
- wp_debug_backtrace_summary() — Return a comma-separated string of functions that have been called to get to the current point in code.
- wp_get_environment_type() — Retrieves the current environment type.
System data
For debugging, WP has a class WP_Debug_Data. For example, using the following method we can get a bunch of data about the system:
require_once ABSPATH . '/wp-admin/includes/class-wp-debug-data.php';
require_once ABSPATH . '/wp-admin/includes/update.php';
require_once ABSPATH . '/wp-admin/includes/misc.php';

$data = WP_Debug_Data::debug_data();

print_r( $data );
We get a big data set:
Array
(
	[wp-core] => Array
		(
			[label] => WordPress
			[fields] => Array
				(
					[version] => array( data )

					[site_language] => array( data )

					[user_language] => array( data )

					[timezone] => array( data )

					[home_url] => array( data )

					[site_url] => array( data )

					[permalink] => array( data )

					[https_status] => array( data )

					[multisite] => array( data )

					[user_registration] => array( data )

					[blog_public] => array( data )

					[default_comment_status] => array( data )

					[environment_type] => array( data )

					[user_count] => array( data )

					[dotorg_communication] => array( data )

				)

		)

	[wp-paths-sizes] => Array
		(
			[label] => Directories and Sizes
			[fields] => Array
				(
					[wordpress_path] => array( data )

					[wordpress_size] => array( data )

					[uploads_path] => array( data )

					[uploads_size] => array( data )

					[themes_path] => array( data )

					[themes_size] => array( data )

					[plugins_path] => array( data )

					[plugins_size] => array( data )

					[database_size] => array( data )

					[total_size] => array( data )

				)

		)

	[wp-dropins] => Array
		(
			[label] => Drop-ins
			[show_count] => 1
			[description] => Drop-ins are single files, found in the /public_html/assets directory, that replace or enhance WordPress features in ways that are not possible for traditional plugins.
			[fields] => Array
				(
					[maintenance.php] => array( data )

					[object-cache.php] => array( data )

				)

		)

	[wp-active-theme] => Array
		(
			[label] => Active Theme
			[fields] => Array
				(
					[name] => array( data )

					[version] => array( data )

					[author] => array( data )

					[author_website] => array( data )

					[parent_theme] => array( data )

					[theme_features] => array( data )

					[theme_path] => array( data )

					[auto_update] => array( data )

				)

		)

	[wp-parent-theme] => Array
		(
			[label] => Parent Theme
			[fields] => Array( data )
		)

	[wp-themes-inactive] => Array
		(
			[label] => Inactive Themes
			[show_count] => 1
			[fields] => Array
				(
					[Dummy] => array( data )

				)

		)

	[wp-mu-plugins] => Array
		(
			[label] => Must Use Plugins
			[show_count] => 1
			[fields] => Array
				(
					[disable-plugins-in-front.php] => array( data )

					[main.php] => array( data )

					[not_support_browsers_redirect.php] => array( data )

					[POMOdoro Translation Cache] => array( data )

					[protect-malicious-queries.php] => array( data )

					[Rus to Lat] => array( data )

				)

		)

	[wp-plugins-active] => Array
		(
			[label] => Active Plugins
			[show_count] => 1
			[fields] => Array
				(
					[AJAX Simply] => array( data )

					[Democracy Poll] => array( data )

					[Disable Emojis (GDPR friendly)] => array( data )

					[Display Active Plugins First] => array( data )

					[Kama Breadcrumbs] => array( data )

					[Kama Postviews] => array( data )

					[Kama SpamBlock] => array( data )

					[Kama Thumbnail Pro] => array( data )

					[Redis Object Cache] => array( data )

				)

		)

	[wp-plugins-inactive] => Array
		(
			[label] => Inactive Plugins
			[show_count] => 1
			[fields] => Array
				(
					[404 Error Monitor] => array( data )

					[Category Order and Taxonomy Terms Order] => array( data )

					[Contact Form 7] => array( data )

					[Kama Thumbnail] => array( data )

					[Query Monitor] => array( data )

					[Query Monitor Extend] => array( data )

					[Right Now Reloaded] => array( data )

					[Three Column Screen Layout] => array( data )

					[TinyPNG - JPEG, PNG & WebP image compression] => array( data )

					[User Role Editor] => array( data )

					[Widget Logic] => array( data )

					[WooCommerce] => array( data )

					[WordPress Sphinx Search Plugin] => array( data )

					[WP Crontrol] => array( data )

					[WP Super Cache] => array( data )

					[Yoast SEO] => array( data )

				)

		)

	[wp-media] => Array
		(
			[label] => Media Handling
			[fields] => Array
				(
					[image_editor] => array( data )

					[imagick_module_version] => array( data )

					[imagemagick_version] => array( data )

					[imagick_version] => array( data )

					[file_uploads] => array( data )

					[post_max_size] => array( data )

					[upload_max_filesize] => array( data )

					[max_effective_size] => array( data )

					[max_file_uploads] => array( data )

					[imagick_limits] => Array ( data )

					[imagemagick_file_formats] => Array( JPEG, JPG, MOV, MP4, MPEG, MPG, PNG, PNG24, WBMP, WEBP, WMV ... )

					[gd_version] => array( data )

					[gd_formats] => array( data )

					[ghostscript_version] => array( data )

				)

		)

	[wp-server] => Array
		(
			[label] => Server
			[description] => The options shown below relate to your server setup. If changes are required, you may need your web host’s assistance.
			[fields] => Array
				(
					[server_architecture] => array( data )

					[httpd_software] => array( data )

					[php_version] => array( data )

					[php_sapi] => array( data )

					[max_input_variables] => array( data )

					[time_limit] => array( data )

					[memory_limit] => array( data )

					[max_input_time] => array( data )

					[upload_max_filesize] => array( data )

					[php_post_max_size] => array( data )

					[curl_version] => array( data )

					[suhosin] => array( data )

					[imagick_availability] => array( data )

					[pretty_permalinks] => array( data )

				)

		)

	[wp-database] => Array
		(
			[label] => Database
			[fields] => Array
				(
					[extension] => array( data )

					[server_version] => array( data )

					[client_version] => array( data )

					[database_user] => array( data )

					[database_host] => array( data )

					[database_name] => array( data )

					[database_prefix] => array( data )

					[database_charset] => array( data )

					[database_collate] => array( data )

				)

		)

	[wp-constants] => Array
		(
			[label] => WordPress Constants
			[description] => These settings alter where and how parts of WordPress are loaded.
			[fields] => Array
				(
					[ABSPATH] => array( data )

					[WP_HOME] => array( data )

					[WP_SITEURL] => array( data )

					[WP_CONTENT_DIR] => array( data )

					[WP_PLUGIN_DIR] => array( data )

					[WP_MEMORY_LIMIT] => array( data )

					[WP_MAX_MEMORY_LIMIT] => array( data )

					[WP_DEBUG] => array( data )

					[WP_DEBUG_DISPLAY] => array( data )

					[WP_DEBUG_LOG] => array( data )

					[SCRIPT_DEBUG] => array( data )

					[WP_CACHE] => array( data )

					[CONCATENATE_SCRIPTS] => array( data )

					[COMPRESS_SCRIPTS] => array( data )

					[COMPRESS_CSS] => array( data )

					[WP_LOCAL_DEV] => array( data )

					[DB_CHARSET] => array( data )

					[DB_COLLATE] => Array
						(
						)

				)

		)

	[wp-filesystem] => Array
		(
			[label] => Filesystem Permissions
			[description] => Shows whether WordPress is able to write to the directories it needs access to.
			[fields] => Array
				(
					[wordpress] => array( data )

					[wp-content] => array( data )

					[uploads] => array( data )

					[plugins] => array( data )

					[themes] => array( data )

					[mu-plugins] => array( data )

				)

		)

)
Plugins for debugging and profiling in WordPress
There are several plugins in the WP catalog that extend the «debugging» capabilities and provide additional information to identify code weaknesses. Popular ones are:
-
Query Monitor — displays a bunch of useful information about the current page query. How much time was spent, how many SQL queries, what queries, how long each query took, how much memory was spent, what hooks were used, etc.
- Query Monitor Addons
No one likes to see errors on their website. Not only do they look bad to visitors and potential customers, but they also indicate that something’s wrong. But they’re, unfortunately, an inevitable part of running a site. The good news is that following a few best practices and being proactive can dramatically reduce the number of errors you experience.
One way to monitor potential site issues — or troubleshoot existing ones — is to keep and review an error log. Let’s dive into this a bit more.
What is error logging and why is it important?
Error logging is the process of tracking and monitoring issues that occur on a website. This is usually done with a record of simple text files that live on your web server and are updated whenever an error occurs. Error logs are used to identify the number of problems that occur, provide details about each one, and show when it took place.
How to enable error logging
To enable error logging on your WordPress site, you’ll need sFTP access, available with WordPress.com plugin-enabled plans. This allows you to edit your website files remotely. In this case, you’ll be working with the wp-config.php file, which holds the basic configuration settings for your website.
A word of warning: you should only use sFTP and edit your wp-config.php file if you feel comfortable doing so. Mistakes can cause catastrophic errors on your website. If you don’t have experience changing these types of files, you may want to hire a developer or reach out to WordPress.com support for help.
1. Connect to your website via sFTP
You’ll need to start by enabling sFTP on your site. Go to My Site(s) → Settings → Hosting Configuration and click the Enable SFTP button.
Then, you’ll see your sFTP login details: URL, Port Number, Username, and Password. You’ll need to input these into FTP software, like FileZilla, to access your site. Follow these detailed instructions to connect to your WordPress.com website.
2. Find and download your wp-config.php file
Navigate to your wp-config.php file. This sits in the root directory of your file structure, alongside folders such as wp-content. Download this file, so you have a backup copy on hand.
3. Edit the wp-config.php file
Edit your wp-config.php file using a text editor such as Notepad.
Look for define( ‘WP_DEBUG’, false ); and replace this text with the following:
define( ‘WP_DEBUG’, true );
if ( WP_DEBUG ) {
@error_reporting( E_ALL );
@ini_set( ‘log_errors’, true );
@ini_set( ‘log_errors_max_len’, ‘0’ );
define( ‘WP_DEBUG_LOG’, true );
define( ‘WP_DEBUG_DISPLAY’, false );
define( ‘CONCATENATE_SCRIPTS’, false );
define( ‘SAVEQUERIES’, true );
}
You’ve now successfully enabled error logging. You should only have this feature turned on while troubleshooting. Otherwise, it can leave your site more vulnerable to hacking attempts. To disable logging, simply delete the code you just added and restore the following:
define( ‘WP_DEBUG’, false );
How to view the error log manually
Once the log is enabled, you’ll need to load your website to trigger any error codes. Those codes are stored in a file called debug.log, which you can access via sFTP by following the same steps as above.
You can find the debug.log file inside of the wp-content folder. If there are errors, the file will appear. However, if there aren’t any errors, then you won’t see it at all — congratulations!
Once you find the file, download it to your computer to view the full log, using a text editing software like Notepad. It will look something like this:

This file will provide valuable information that will point you, or your developer, to the source of your problem.
How to view the error log using a plugin
Using a plugin to find your error log can be an easier and faster method, depending on your level of experience. In the WordPress dashboard, click on Plugins → Add New. Search for “Error Log Monitor” and click Install → Activate.
This plugin installs a widget on your WordPress dashboard that allows you to access your error log. If you haven’t enabled error logging correctly, the widget will display instructions on how to do so. However, you should ignore these instructions, as they’re incorrect for a WordPress.com installation. Instead, use the ones listed above.

If you can’t see the dashboard widget, click on the Screen options tab at the top of the WordPress dashboard and ensure that “PHP error log” is checked.

How to find the plugin or theme that’s causing an error
Error logs are not inherently easy to read, but they do give insightful information into the cause of an error.
Typically, each line in your error log will display a message, alongside the date and time it happened and the file in which the error occurred. It also lists the line number where the error is located. For example:
Apr 20, 15:08:59
Notice: Undefined index: fg2 in /wordpress/themes/pub/varia/functions.php on line 166
Let’s break this down. First of all, there’s the date and time of the error: April 20, 15:08:59. This helps you determine if this was a one-off glitch or a recurring issue.
Then, you can see the type of error that’s been logged. Here are a few common types of error you may see here:
- Notice. These are more warnings than errors, as they don’t actually stop your website code from executing. While you should still address a notice, your site will most likely still function, although potentially not as designed.
- Parse error. This is typically the result of a mistake in the syntax of the underlying PHP code of the website (often in a theme or plugin). Parse errors include things like missing semicolons, parentheses, and other similar mistakes. A parse error will stop executing code when it hits the problem, so your site may look visibly broken or not function as intended.
- Fatal error. This is often caused by undefined functions or classes, like a typo or poor coding practice. You can avoid it by using high-quality code, along with functions such as class_exists or function_exists.
In this case, the error is a notice.
Next, we see the error itself. In the example above the error is “undefined index.” This is followed by the specific location of the problem. In the above example, the error is occurring with the functions.php file of the Varia theme.
How to fix errors
Now that you can see your errors, it’s time to troubleshoot. Here’s a few things you can try:
- If you’re a developer and the error is in your custom code, go to the line number in the log entry and work to debug.
- If the error is within a theme or plugin, start by checking for any available updates. Keeping your plugins and themes up to date is critical for avoiding bugs and maintaining website security. Once you’ve applied any updates, re-check the error log to see if there are any new entries. If the error still exists, reach out to the plugin author or consider switching to an alternative.
- The error may also be caused by a conflict between two plugins. Try using the WordPress troubleshooting mode to fix this problem.
- If the problem occurred immediately after installing or updating a plugin, deactivate it to see if the error persists. If it doesn’t, the plugin is the likely cause and you may want to find an alternative. If the error occured after a core update, you may need to manually deactivate plugins to find the source.
Troubleshooting with the WordPress error log
WordPress, like any software, may occasionally run into problems. It may seem confusing to find and fix those problems, but the error log can be a huge help! It enables you to learn valuable information that can help you troubleshoot and solve site errors in a timely manner.
To avoid errors, always use well-maintained plugins and themes, and keep on top of updates. Need more help? If you have a WordPress plugin-enabled plan, you benefit from world-class Happiness Engineers that can provide guidance.
In a perfect world, you’d never have a single issue that required debugging. But in the real world, you’ll almost certainly run into issues on your WordPress site that require a look under the hood.
To help you do that, WordPress includes its own built-in debug mode and you can also find useful third-party tools to help you debug WordPress.
In this post, we’ll dig into the built-in WordPress debug mode and show you how to enable it. Then, we’ll also share some of the other ways in which you can debug your WordPress site.
Here’s everything that we’ll cover:
- An introduction to WordPress debug mode and the debug log
- How to enable WordPress debug mode (three methods)
- Some other ways to debug WordPress
What Does WP Debug Do?
The core WordPress software is written in PHP, as are plugins and themes.
If you’re having issues with your site, WordPress debug mode can help you find out what’s going wrong by displaying all PHP errors, notices, and warnings.
Once you enable debug mode, you’ll see messages like this whenever there’s an issue (even if it’s not causing immediate problems):
You can then fix the problem or report it to your developer or the theme/plugin’s developer.
What Is the WordPress Debug Log?
When you enable WordPress debug mode by itself, you’ll see messages like the example above on your site in the moment – but those messages won’t be saved anywhere.
If you want to save them, you can also enable the WordPress debug log to save all of those messages and errors to a file on your server.
When enabled by setting the WP_DEBUG_LOG constant to true, WordPress will write all issues to the following file:
wp-content/debug.log
However, you can also specify a custom file path to write the log to a different location on your server.
If you want to save problems to the log but not publicly display them within the HTML of your pages (like the example screenshot above), you can also use the WP_DEBUG_DISPLAY constant to keep debug mode enabled but not display messages on your site.
Typically, you’ll want to combine WP_DEBUG_DISPLAY with WP_DEBUG_LOG.
Ready to debug your #WordPress site? This guide has you covered 🐛Click to Tweet
How to Enable WordPress Debug Mode
To enable WordPress debug mode, you have several options. We’ll cover three methods to enable it:
How to Enable WordPress Debug Mode in MyKinsta
If you host your WordPress site at Kinsta, we built an easy tool that lets you enable the WordPress debug mode without needing to edit your wp-config.php file.
This tool is convenient for being able to quickly enable debug mode and display messages on your site, but it doesn’t let you control the WordPress debug log or whether or not to display messages on live pages. If you want to use just the debug log, you might prefer the plugin method in the next section.
To get started:
- Open your MyKinsta dashboard.
- Select the site where you want to enable debugging from the Sites list.
- Go to the Tools tab in that site’s dashboard.
- Click Enable under WordPress debugging.

You can use the tool on both your live and staging environments. Whenever possible, though, we’d recommend using it with your staging environment because enabling WordPress debug mode might display details about your site’s PHP code to visitors (which is confusing for visitors and also a security risk).
When you’re finished, you can disable debug mode by clicking the Disable button in your Kinsta dashboard:

How to Use a WordPress Debug Plugin
If you’re not hosting at Kinsta, you can also find free WordPress debug plugins that make it easy to enable debug mode. There are several options at WordPress.org, but we recommend the free WP Debugging plugin from Andy Fragen.

Once you install and activate the plugin, it starts working right away. By default, it sets the following constants to true (that is, it enables the following features):
WP_DEBUG– enables debug mode.WP_DEBUG_LOG– saves messages to a log file.SCRIPT_DEBUGSAVEQUERIES
We’ll cover what the last two constants do a little later on in this post.
To configure a few options, you can go to Tools → WP Debugging:
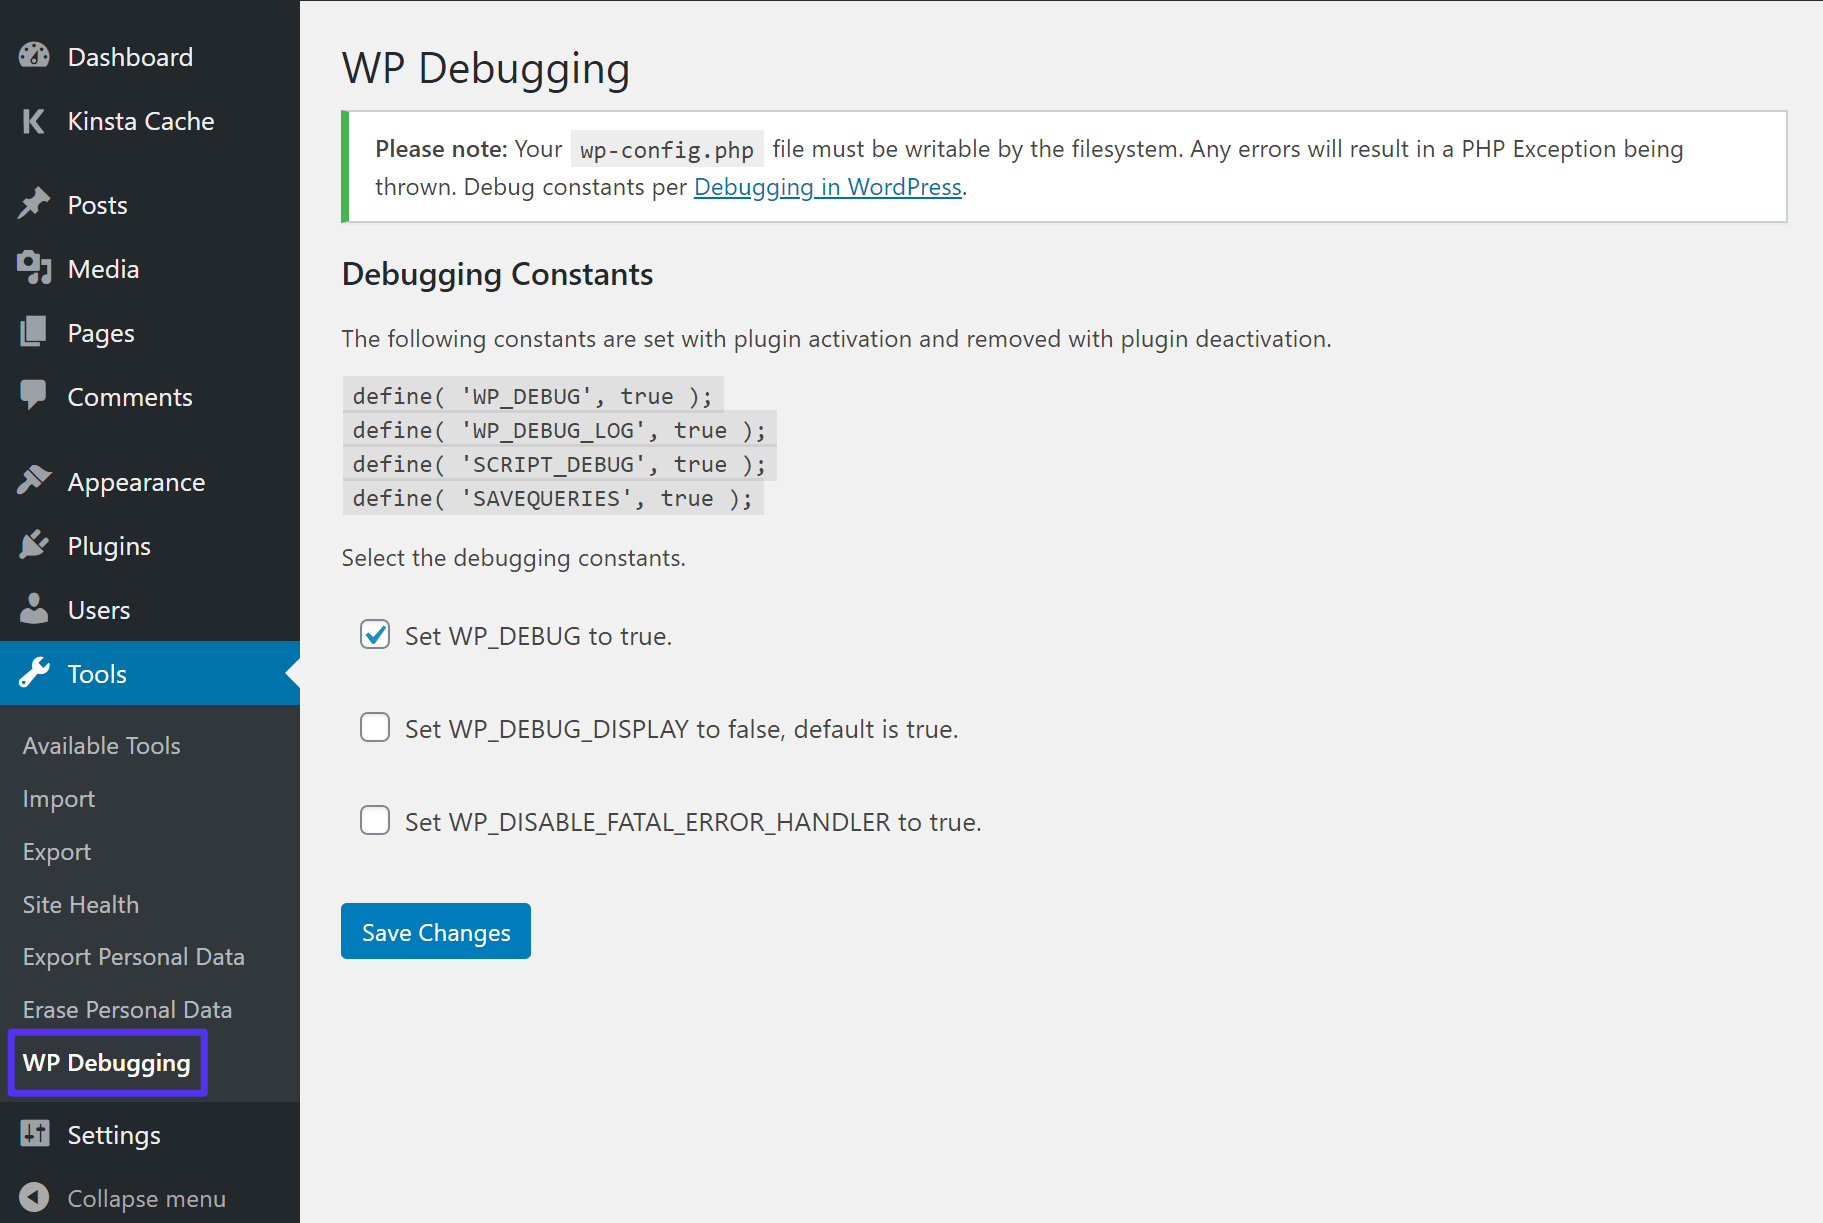
Once you’re finished, make sure to disable the plugin to disable debug mode.
How to Manually Enable WordPress Debug Mode
Finally, you can also enable WordPress debug mode by manually adding the constants to your wp-config.php file.
To get started, connect to your server via FTP and edit the wp-config.php file. By default, this file is in the root folder of your site (unless you moved it for security reasons).
To enable just the basic WordPress debug mode, add the following code snippet above the line that says /* That’s all, stop editing! Happy blogging. */:
// Enable WP_DEBUG mode

define( 'WP_DEBUG', true );
You can also use some of the following constants according to your preferences:
// Enable Debug logging to the /wp-content/debug.log file

define( 'WP_DEBUG_LOG', true );

// Disable display of errors and warnings

define( 'WP_DEBUG_DISPLAY', false );

@ini_set( 'display_errors', 0 );
Once you’re finished, you can either set the constants to false or just remove the snippet to disable debug mode.
Make Sure to Disable Debug Mode in WordPress When You’re Finished
The debug mode is useful when you’re trying to troubleshoot problems with WordPress, but you shouldn’t leave it enabled 24/7 because it can reveal text from your PHP code to website visitors.
We mentioned this above – but this is just a reminder to always disable debug mode when you’re finished troubleshooting.
Other Ways to Debug WordPress
Beyond the built-in debug tool that we featured above, there are several other built-in and third-party tools to help you debug your WordPress site.
Script Debug
SCRIPT_DEBUG is another built-in constant that forces WordPress to use the dev versions of core CSS and JavaScript files instead of the minified versions that it usually loads.
This can be helpful if you’re testing changes to the built-in .js or .css files.
To enable SCRIPT_DEBUG, you can either:
- Use the free WP Debugging plugin from above, which enables it by default.
- Add the following constant to your wp-config.php file –
define( 'SCRIPT_DEBUG', true );
Database Query Debugging
If you’re having issues with your site’s database, you can enable database query logging using the SAVEQUERIES constant to track:
- Each database query.
- The function that called the database query.
- How long the query took.
To enable query logging, you can either:
- Use the free WP Debugging plugin from above, which enables it by default.
- Add the following constant to your wp-config.php file –
define( 'SAVEQUERIES', true );
Note: this will impact your site’s performance so try to use it on a staging site whenever possible and disable it as soon as you’re finished.
Query Monitor Plugin
The Query Monitor plugin is a free plugin that’s helpful for debugging a number of different areas in WordPress including:
- Database queries.
- PHP errors.
- Hooks and actions.
- Block editor blocks.
- Enqueued scripts and stylesheets.
- HTTP API calls.
- User capabilities.
Overall, it’s one of the best WordPress debug tools that you’ll find, which is why it has almost a perfect 5-star rating on over 320 reviews.
Once you install and activate the plugin, you’ll get some new options on the WordPress toolbar that display debug information. When clicked, those options will open a new Query Monitor box that gives you more information:

For a more detailed look, we have an entire post on how to use the Query Monitor plugin.
New Relic
New Relic is a premium tool for analyzing and debugging your site’s performance. It can help you discover bottlenecks and issues that are affecting your site’s performance.
Kinsta already includes the built-in APM tool. However, you can still use New Relic in the MyKinsta dashboard, provided you have your own license.
Server Logs
Finally, your server logs can also be a useful tool in debugging WordPress.
If you host at Kinsta, you can view all of your server logs from the Logs tab in a site’s dashboard:

If you host elsewhere, you’ll need to consult your host’s documentation to learn where you can access your server logs.
It’s time to take a look under the hood and debug your #WordPress site 🐛 This guide has everything you need to get started 💪Click to Tweet
Summary
If you need to debug WordPress, the built-in WordPress debug mode provides a useful way to view PHP errors and notices.
If you host at Kinsta, you can enable it right from your dashboard. Otherwise, you can enable it with plugins or by adding code snippets to your site’s wp-config.php file.
For more help, you can also use other built-in tools or third-party tools like New Relic (your own license is required) and the free Query Monitor plugin.
Do you have any other questions about how to debug WordPress? Leave a comment and let us know!
Get all your applications, databases and WordPress sites online and under one roof. Our feature-packed, high-performance cloud platform includes:
- Easy setup and management in the MyKinsta dashboard
- 24/7 expert support
- The best Google Cloud Platform hardware and network, powered by Kubernetes for maximum scalability
- An enterprise-level Cloudflare integration for speed and security
- Global audience reach with up to 35 data centers and 275 PoPs worldwide
Test it yourself with $20 off your first month of Application Hosting or Database Hosting. Explore our plans or talk to sales to find your best fit.
In a perfect world, you’d never have a single issue that required debugging. But in the real world, you’ll almost certainly run into issues on your WordPress site that require a look under the hood.
To help you do that, WordPress includes its own built-in debug mode and you can also find useful third-party tools to help you debug WordPress.
In this post, we’ll dig into the built-in WordPress debug mode and show you how to enable it. Then, we’ll also share some of the other ways in which you can debug your WordPress site.
Here’s everything that we’ll cover:
- An introduction to WordPress debug mode and the debug log
- How to enable WordPress debug mode (three methods)
- Some other ways to debug WordPress
What Does WP Debug Do?
The core WordPress software is written in PHP, as are plugins and themes.
If you’re having issues with your site, WordPress debug mode can help you find out what’s going wrong by displaying all PHP errors, notices, and warnings.
Once you enable debug mode, you’ll see messages like this whenever there’s an issue (even if it’s not causing immediate problems):
You can then fix the problem or report it to your developer or the theme/plugin’s developer.
What Is the WordPress Debug Log?
When you enable WordPress debug mode by itself, you’ll see messages like the example above on your site in the moment – but those messages won’t be saved anywhere.
If you want to save them, you can also enable the WordPress debug log to save all of those messages and errors to a file on your server.
When enabled by setting the WP_DEBUG_LOG constant to true, WordPress will write all issues to the following file:
wp-content/debug.log
However, you can also specify a custom file path to write the log to a different location on your server.
If you want to save problems to the log but not publicly display them within the HTML of your pages (like the example screenshot above), you can also use the WP_DEBUG_DISPLAY constant to keep debug mode enabled but not display messages on your site.
Typically, you’ll want to combine WP_DEBUG_DISPLAY with WP_DEBUG_LOG.
Ready to debug your #WordPress site? This guide has you covered 🐛Click to Tweet
How to Enable WordPress Debug Mode
To enable WordPress debug mode, you have several options. We’ll cover three methods to enable it:
How to Enable WordPress Debug Mode in MyKinsta
If you host your WordPress site at Kinsta, we built an easy tool that lets you enable the WordPress debug mode without needing to edit your wp-config.php file.
This tool is convenient for being able to quickly enable debug mode and display messages on your site, but it doesn’t let you control the WordPress debug log or whether or not to display messages on live pages. If you want to use just the debug log, you might prefer the plugin method in the next section.
To get started:
- Open your MyKinsta dashboard.
- Select the site where you want to enable debugging from the Sites list.
- Go to the Tools tab in that site’s dashboard.
- Click Enable under WordPress debugging.
You can use the tool on both your live and staging environments. Whenever possible, though, we’d recommend using it with your staging environment because enabling WordPress debug mode might display details about your site’s PHP code to visitors (which is confusing for visitors and also a security risk).
When you’re finished, you can disable debug mode by clicking the Disable button in your Kinsta dashboard:
How to Use a WordPress Debug Plugin
If you’re not hosting at Kinsta, you can also find free WordPress debug plugins that make it easy to enable debug mode. There are several options at WordPress.org, but we recommend the free WP Debugging plugin from Andy Fragen.
Once you install and activate the plugin, it starts working right away. By default, it sets the following constants to true (that is, it enables the following features):
WP_DEBUG– enables debug mode.WP_DEBUG_LOG– saves messages to a log file.SCRIPT_DEBUGSAVEQUERIES
We’ll cover what the last two constants do a little later on in this post.
To configure a few options, you can go to Tools → WP Debugging:
Once you’re finished, make sure to disable the plugin to disable debug mode.
How to Manually Enable WordPress Debug Mode
Finally, you can also enable WordPress debug mode by manually adding the constants to your wp-config.php file.
To get started, connect to your server via FTP and edit the wp-config.php file. By default, this file is in the root folder of your site (unless you moved it for security reasons).
To enable just the basic WordPress debug mode, add the following code snippet above the line that says /* That’s all, stop editing! Happy blogging. */:
// Enable WP_DEBUG mode

define( 'WP_DEBUG', true );
You can also use some of the following constants according to your preferences:
// Enable Debug logging to the /wp-content/debug.log file

define( 'WP_DEBUG_LOG', true );

// Disable display of errors and warnings

define( 'WP_DEBUG_DISPLAY', false );

@ini_set( 'display_errors', 0 );
Once you’re finished, you can either set the constants to false or just remove the snippet to disable debug mode.
Make Sure to Disable Debug Mode in WordPress When You’re Finished
The debug mode is useful when you’re trying to troubleshoot problems with WordPress, but you shouldn’t leave it enabled 24/7 because it can reveal text from your PHP code to website visitors.
We mentioned this above – but this is just a reminder to always disable debug mode when you’re finished troubleshooting.
Other Ways to Debug WordPress
Beyond the built-in debug tool that we featured above, there are several other built-in and third-party tools to help you debug your WordPress site.
Script Debug
SCRIPT_DEBUG is another built-in constant that forces WordPress to use the dev versions of core CSS and JavaScript files instead of the minified versions that it usually loads.
This can be helpful if you’re testing changes to the built-in .js or .css files.
To enable SCRIPT_DEBUG, you can either:
- Use the free WP Debugging plugin from above, which enables it by default.
- Add the following constant to your wp-config.php file –
define( 'SCRIPT_DEBUG', true );
Database Query Debugging
If you’re having issues with your site’s database, you can enable database query logging using the SAVEQUERIES constant to track:
- Each database query.
- The function that called the database query.
- How long the query took.
To enable query logging, you can either:
- Use the free WP Debugging plugin from above, which enables it by default.
- Add the following constant to your wp-config.php file –
define( 'SAVEQUERIES', true );
Note: this will impact your site’s performance so try to use it on a staging site whenever possible and disable it as soon as you’re finished.
Query Monitor Plugin
The Query Monitor plugin is a free plugin that’s helpful for debugging a number of different areas in WordPress including:
- Database queries.
- PHP errors.
- Hooks and actions.
- Block editor blocks.
- Enqueued scripts and stylesheets.
- HTTP API calls.
- User capabilities.
Overall, it’s one of the best WordPress debug tools that you’ll find, which is why it has almost a perfect 5-star rating on over 320 reviews.
Once you install and activate the plugin, you’ll get some new options on the WordPress toolbar that display debug information. When clicked, those options will open a new Query Monitor box that gives you more information:
For a more detailed look, we have an entire post on how to use the Query Monitor plugin.
New Relic
New Relic is a premium tool for analyzing and debugging your site’s performance. It can help you discover bottlenecks and issues that are affecting your site’s performance.
Kinsta already includes the built-in APM tool. However, you can still use New Relic in the MyKinsta dashboard, provided you have your own license.
Server Logs
Finally, your server logs can also be a useful tool in debugging WordPress.
If you host at Kinsta, you can view all of your server logs from the Logs tab in a site’s dashboard:
If you host elsewhere, you’ll need to consult your host’s documentation to learn where you can access your server logs.
It’s time to take a look under the hood and debug your #WordPress site 🐛 This guide has everything you need to get started 💪Click to Tweet
Summary
If you need to debug WordPress, the built-in WordPress debug mode provides a useful way to view PHP errors and notices.
If you host at Kinsta, you can enable it right from your dashboard. Otherwise, you can enable it with plugins or by adding code snippets to your site’s wp-config.php file.
For more help, you can also use other built-in tools or third-party tools like New Relic (your own license is required) and the free Query Monitor plugin.
Do you have any other questions about how to debug WordPress? Leave a comment and let us know!
Get all your applications, databases and WordPress sites online and under one roof. Our feature-packed, high-performance cloud platform includes:
- Easy setup and management in the MyKinsta dashboard
- 24/7 expert support
- The best Google Cloud Platform hardware and network, powered by Kubernetes for maximum scalability
- An enterprise-level Cloudflare integration for speed and security
- Global audience reach with up to 35 data centers and 275 PoPs worldwide
Test it yourself with $20 off your first month of Application Hosting or Database Hosting. Explore our plans or talk to sales to find your best fit.
Скриншот ниже выглядит страшновато 🙂 , но именно с таким текстом вы случайно можете встретиться на страницах вашего сайта, если определенный плагин или иной код вызывает ошибки PHP. С другой стороны, именно этот код будет вам полезен в процессе поиска проблемы.
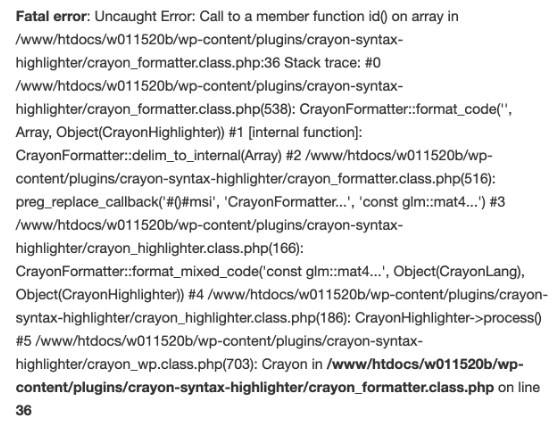
В первую очередь, следует понимать, что ошибки бывают разной степени “критичности”. Чаще всего вы встретите так называемые предупреждения “Warnings“, а также фатальные ошибки “Fatal errors“.
Первый тип в большинстве случаев не ломает ваш сайт, а только досаждает выводом определенных данных об ошибке где-то на страницах сайта или админ-панели WordPress. В зависимости от настроек вашего хостинга, такие сообщения могут по умолчанию выводиться или скрываться.
Во втором случае вы можете просто видеть белый экран вместо какой-то из страниц.
Как отключить вывод ошибок
Следующий код выключает вывод ошибок на страницах сайта. Его необходимо добавить в файл wp-config.php, находящийся в корне вашего сайта. Проще всего найти в этом файле текст define ( 'WP_DEBUG ", false); и вместо него добавить:
error_reporting(0); // выключаем вывод информации об ошибках
ini_set('display_errors', 0); // выключаем вывод информации об ошибках на экран
define('WP_DEBUG', false);
define('WP_DEBUG_DISPLAY', false);
Не забывайте перед редактированием файлов PHP на сайте делать их резервную копию, это позволит быструю вернуться на шаг назад в случае каких-то механических ошибок.
Как включить вывод ошибок?
Следующий код наоборот включает вывод ошибок, что позволит вам или вашему вебмастеру скорее и проще узнать о причинах проблем на сайте, очень помогает, когда вместо страницы сайта показывается просто белая страница без данных:
error_reporting(E_ALL); // включаем вывод ошибок
ini_set('display_errors', 1); // включаем вывод ошибок на экран
define('WP_DEBUG', true);
define('WP_DEBUG_DISPLAY', true);
Разместить этот код необходимо один в один как и предыдущий в файле wp-config.php
Плагины для поиска ошибок в WordPress (дебаг и профилирование)
Для WordPress есть несколько замечательных плагинов, которые позволят более глубоко погрузиться в процесс поиска ошибок и их причин. Вот несколько популярных из них:
- Query Monitor – выводит в футере довольно много полезной информации, в частности о запросах, выполненных во время генерации текущей страницы. Среди всей выводимой информации приведены время генерации страницы, сколько было SQL запросов, какие именно и время их выполнения, сколько памяти потрачено, какие хуки использованы и другое.
- Debug Bar – набор плагинов для дебага. Это основной плагин, к которому можно подключать дополнительные, расширяющие функциональность основного.
- Log Deprecated Notices – записывает информацию о наличии устаревших функций в WordPress или их параметров, работа плагина не зависит от значений константы WP_DEBUG, то есть работает всегда.
- WordPress mu-plugin for debugging – альтернативный плагин на базе библиотеки Kint.
- Clockwork для WordPress – интересный плагин для отладки через консоль браузеров Google Chrome или Firefox, есть возможность отладки AJAX-запросов.
Еще интересное:
Акции, скидки на хостинг и домены

Подарки за отзывы
Почему? Каждый из нас знает, что позитивные отзывы оставляют единицы, в первую очередь просто из-за лени 🙂 . А для […]
Подробнее
Новости индустрии

Новая цена регистрации доменов
Администратор домена .IN.UA анонсировал повышение цен на регистрацию доменов in.ua, od.ua, odessa.ua, mk.ua, nikolaev.ua на более чем 40 процентов с 1 октября 2022 года. В связи […]
Подробнее

От автора: для разработчика крайне важно уметь отлаживать код. В этом уроке я расскажу вам про 11 способов по отладке WordPress и ошибок PHP. Первым в списке стоит знаменитый WP_Debug, после чего мы переключимся на более продвинутые методы.
Сначала давайте приведем типы распространенных ошибок в PHP:
A. Замечание: сообщение об ошибке с самым низким уровнем важности в PHP. Не факт, что ваш код неправильный, просто в каких-то местах его можно переписать. Пример: в функцию, которая ожидает строку, передано null.
B. Предупреждение: более серьезная ошибка, но она не прекращает работу скрипта. Пример: подключение несуществующего файла через include().
C. Фатальная ошибка: опасный индикатор того, что что-то пошло действительно не так, и скрипт был остановлен. Пример: вызов несуществующей функции.

Бесплатный курс «Создание тем на WordPress. Быстрый старт»
Изучите курс и узнайте, как создавать уникальные темы на WordPress с нестандартной структурой страниц
Скачать курс
1 – константа WP_DEBUG
В WP существует глобальная константа, с помощью которой можно производить отладку на определенном уровне – WP_DEBUG. Вместе с этой константой идут и две другие не менее важные — WP_DEUBG_DISPLAY и WP_DEBUG_LOG.
С помощью WP_DEBUG можно включать и выключать режим отладки. WP_DEUBG_DISPLAY прячет и показывает ошибки. WP_DEBUG_LOG сохраняет ошибки в wp-content/debug.log. Задать true или false для этих трех констант можно в файле wp-config.php:
|
define(«WP_DEBUG», true); define(«WP_DEBUG_DISPLAY», true); define(«WP_DEBUG_LOG», true); |
2 – метод is_wp_error()
Также для отладки в WP можно воспользоваться методом is_wp_error();. Данный метод проверяет передаваемое значение на тип WP_Error. WP_Error – объект, который можно получить в случае неудачного выполнения метода. Пример:
|
$post = array( ‘post_title’ => ‘Test post’, ‘post_content’ => ‘This is my post.’, ‘post_status’ => ‘publish’, ‘post_author’ => 1 ); $result = wp_insert_post( $my_post ); if(is_wp_error($result)){ echo $return—>get_error_message(); } |
Код выше пытается добавить новую статью с помощью метода wp_insert_post(). Если метод не отработает, нам вернется объект WP_Error. Данный объект можно поймать и вытянуть из него сообщение об ошибке.
3 – плагин Debug Bar
Для отладки ошибок в WP можно воспользоваться плагином Debug Bar. С помощью этого полезного инструмента можно получить информацию по всем страницам сайта.
После установки у вас появится новая кнопка для отладки. По клику на нее можно провести анализ запросов, шаблонов, PHP установок и т.д.
4 – тестовый сайт
Крайне важно иметь несколько копий сайта: настоящую, тестовую и для разработки. У меня обычно есть две установки WP на один сайт. Это очень важно, ведь вы не хотите, чтобы ваши скрипты прекращали работу, как только вы включили сообщения об ошибках.
5 – плагин Simply Show Hooks
Simply Show Hooks – плагин, показывающий все хуки, которые есть на странице. Если у вас возникла такая ситуация, когда все отчеты не находят ошибку, то вам придется вылавливать все запущенные хуки.
С помощью данного плагина можно посмотреть все запущенные на странице экшены и фильтры. Код каждого хука можно проанализировать и отладить. Также плагин позволяет определить приоритет хуков.
Бесплатный курс «Создание тем на WordPress. Быстрый старт»
Изучите курс и узнайте, как создавать уникальные темы на WordPress с нестандартной структурой страниц
Скачать курс
6 – отчет об ошибках WPDB
Если для работы с базой данных вы используете класс wpdb, вам понадобится отчет об ошибках. Не важно, будет ли это просто проверка правильности работы запросов или отображение сообщений об ошибках. Пример:
|
global $wpdb; // перед посылкой запроса: $wpdb—>show_errors = TRUE; $result = $wpdb—>get_results(«SELECT field_value FROM table_name»); if(! $result){ $wpdb—>print_error(); // или можно показывать последнюю попытку. echo $wpdb—>last_query; } |
7 – логи ошибок сервера
На каком-то этапе ни WP ни PHP не смогут отловить ошибки в коде. К примеру, если скрипт превысил максимальное время выполнения, PHP не выдаст ошибку. А вот Apache (или другой сервер) выдаст что-то типа «Internal Server Error». В такой ситуации нужно открыть файл логов с ошибками и посмотреть, где же закралась ошибка: в PHP или в WP. Узнать, где хранятся логи можно у провайдера хостинга. Обычно папка называется logs.
8 – логи ошибок PHP
В PHP есть свой уровень сообщений об ошибках. Очень полезная штука, особенно если запускается что-то не из WP и вызывает ряд каких-то проблем. Включить логи об ошибках и указать место их хранения можно в файле php.ini.
|
error_reporting = E_ALL | E_STRICT error_log = /var/log/php_error.log |
Строки выше включают отчеты об ошибках и задают специальный путь для хранения. Также можно запустить функцию phpinfo() и проверить error_log.
9 – проверка синтаксиса PHP
Если ваш хостинг-провайдер ограничил доступ к файлу php.ini, или у вас нет доступа к логам ошибок, ситуация немного усложняется. Однако в сети полно инструментов для решения проблемы, когда перед вами пустая страница, а ошибок нет. Один из таких инструментов — PHP Code Checker.
PHP Code Checker – инструмент для проверки ошибок синтаксиса. Он находит пропущенные точки с запятой и фигурные скобки – очень удобная штука.
10 – PHP IDE
Если PHP Code Checker не нашел ошибок в синтаксисе, нужно прибегнуть к более мощному инструменту. Мощная среда разработки типа PhpStorm подойдет для более продвинутой отладки и разобьет ваш код на части.
Эта IDE помогает в таких ситуациях, когда вы пытаете распечатать переменную, в которой хранится какая-то строка, но ничего не происходит. Быть может, где-то в коде вы переписываете эту переменную. Очень важно работать в мощной среде разработки типа PhpStorm, Eclipse или другой.
11 – отключение кэша браузера
Если вы работаете на front-end’е сайта, тогда вам нужно отключить кэш в браузере. Это обязательный шаг, так как если вы работаете с JS кодом, а он не обновлен или обновлен, но не показывает ошибок, что еще хуже, вам придется отключить кэш.
Отключение кэша говорит браузеру, чтобы тот больше не работал со старыми файлами сайта, которые хранятся на вашем жестком диске. Это относится к файлам CSS и JS.
Чтобы отключить кэш в браузере Chrome, откройте панель разработчика, кликнув правой кнопкой мыши по любому элементу страницы. Перейдите во вкладку сеть. Поставьте галочку на пункте Disable Cache вверху.
Заключение
Эти 11 советов – ваше руководство по отладке. Сама отладка может быть очень утомительной в большинстве случаев, но эти советы сделают этот процесс проще. Пишите свои советы по отладке WP в комментариях!
Автор: Loai Nagati
Источник: //www.sitepoint.com/
Редакция: Команда webformyself.
Бесплатный курс «Создание тем на WordPress. Быстрый старт»
Изучите курс и узнайте, как создавать уникальные темы на WordPress с нестандартной структурой страниц
Скачать курс

Создание тем на WordPress. Быстрый старт
Изучите курс и узнайте, как создать тему на WordPress
Смотреть
WordPress — одна из самых популярных систем управления контентом (CMS), доступных сегодня на рынке. Он построен на различных языках разработки, в основе которых лежит PHP. Каждый раз, когда пользователь посещает сайт WordPress, код PHP компилируется модулем PHP, установленным на сервере (Apache или Nginx). По сути, это означает, что во время обработки запросов пользователя может произойти множество ошибок PHP. Если это так, это указывает на проблему с кодом PHP. Следовательно, вы должны понимать базовые знания о том, как проверять эти ошибки PHP, прежде чем искать решение. В этой статье мы объясним, как отлаживать ошибки PHP на сайте WordPress, а также включить ведение журнала ошибок.
Ошибки PHP могут быть предупреждением или фатальной ошибкой, нарушающей работу вашего сайта. Эти проблемы могут возникать по разным причинам, указанным ниже.
- Пропуск точки с запятой в синтаксисе
- Вызов неправильной переменной
- Конфликт с другим плагином или даже с параметром сервера
- Несовместимый плагин или тема с последней версией PHP
Не паникуйте, когда видите ошибки в интерфейсе браузера или в панели администратора. Поскольку вам необходимо часто обновлять ядро WordPress, версию PHP, тему и плагины, часто возникают ошибки из-за совместимости и по другим причинам.
Почему вы должны отслеживать ошибки PHP?
Внимательное наблюдение за ошибками PHP на вашем сайте имеет решающее значение по двум основным аспектам.
- Безопасность — информация об ошибках PHP может подвергнуть ваш сайт вредоносным атакам. Следовательно, понимание и исправление ошибок является обязательной задачей для поддержания безопасности и надежности веб-сайта.
- Оптимизация — ошибки PHP могут снизить скорость вашего сайта, и если эти проблемы останутся незамеченными, они могут снизить производительность и потерять пропускную способность.
Хотя многие установки по умолчанию не предоставляют уведомления об этих проблемах, проблемы PHP часто возникают неожиданно и без предупреждения. Даже незначительные изменения на вашем веб-сайте могут привести к их изменению в настройках вашего сервера, настройке базы данных или файлах WordPress.
Правда остается, даже если внешне ваш сайт выглядит нормально, он может страдать от незаметных проблем с PHP, которые необходимо немедленно решать. И поэтому администраторы WordPress должны следить за ошибками PHP.
Отладка ошибок PHP в WordPress
В этой статье мы рассмотрим, как отлаживать ошибки PHP в WordPress двумя способами.
- Отлаживайте ошибки PHP вручную с помощью кода.
- Отлаживайте ошибки PHP с помощью плагинов.
1. Отладка ошибок PHP вручную с помощью кода
Если вы разработчик или хорошо владеете одним или двумя языками программирования, этот метод будет намного проще. Возможно, это не самый быстрый вариант, поскольку вам придется писать несколько строк кода, но даже это делает его более интересным. В этом конкретном посте мы отредактируем код в Visual Studio Code, поскольку сайт размещен локально на LAMPP. Если ваш сайт уже работает, вы можете редактировать код через приложение File Manager или FTP.
Мы рассмотрим три основные константы PHP:
| WP_DEBUG | Включить ошибки отладки |
| WP_DEBUG_DISPLAY | Отображение ошибок в веб-интерфейсе браузера |
| WP_DEBUG_LOG | Включить запись ошибок в файл журнала |
WP_DEBUG и WP_DEBUG_DISPLAY
На нашем тестовом сайте прямо сейчас на сайте WordPress не отображаются ошибки PHP, как показано на изображении ниже. Это потому, что по умолчанию WordPress предотвращает отображение ошибок в браузере, задав для параметра WP_DEBUG значение false.
Чтобы установить для отладки WordPress значение true, перейдите в корневую папку установки вашего сайта и найдите файл wp-config.php. Отредактируйте файл и проверьте, содержит ли он следующую строку.
define( 'WP_DEBUG', false );Он должен выглядеть так, как показано на изображении ниже.
Если строка есть, просто измените значение WP_DEBUG на true. В противном случае вы можете вставить новую строку со значением WP_DEBUG как true. Кроме того, добавьте строку ниже, чтобы включить отображение ошибок PHP в браузере.
define( 'WP_DEBUG_DISPLAY', true );Когда оба параметра включены, он должен выглядеть, как показано на изображении ниже.
Сохраните файл, чтобы применить изменения и загрузить обратно на свой сервер. Теперь, когда мы перезагружаем наш сайт, мы можем видеть ошибки, отображаемые на экране. Как видите, это предупреждающее сообщение, в котором упоминается, что у темы есть синтаксическая проблема, которая может вызвать ошибку в будущей версии PHP. Обратите внимание, что в среде localhost появляются некоторые ошибки PHP, которые не применимы к действующим сайтам.
К сожалению, эти ошибки появляются в браузере, что было бы не совсем профессионально. Кроме того, некоторые ошибки могут выявить уязвимости и недостатки безопасности, имеющиеся на сайте. Надежным решением было бы создать файл журнала, в который мы бы сбрасывали все эти ошибки.
Но сначала не забудьте отключить отображение ошибок, отредактировав значение WP_DEBUG_DISPLAY, как показано на изображении ниже. Оставьте значение WP_DEBUG равным true, чтобы мы могли регистрировать ошибки.
Журнал ошибок с помощью WP_DEBUG_LOG
Ниже приведены некоторые из ситуаций, в которых вы можете создать файл журнала ошибок WordPress:
- Весь ваш сайт упал
- Обратите внимание на пустой экран при попытке открыть сайт
- Проблемы с производительностью вашего сайта
- Появляется предупреждение с кодами состояния HTTP 401, 404 или 500
- Если плагин или тема работает некорректно. Вы также можете рассмотреть возможность создания журналов ошибок, чтобы получить более подробную информацию о проблеме.
Чтобы записать ошибки WordPress в файл журнала, откройте файл wp-config.php и найдите строку определить ('WP_DEBUG_LOG,' истина);. Если его нет, вы можете вставить новую строку. Иногда строка также комментируется, и обязательно удалите комментарии и установите для параметра WP_DEBUG_LOG значение true, как показано на изображении ниже.
Сохраните файл и загрузите обратно на свой сервер. Теперь перезагрузите сайт в браузере. WordPress создаст файл журнала с именем debug.log в каталоге wp-content, в который будут записаны все ошибки PHP на вашем сайте.
Когда мы открываем файл, вы видите, что он содержит все ошибки, которые отображались на нашем сайте.
Это может быть весьма кстати, особенно когда вы работаете в реальной среде и не хотите, чтобы пользователи видели ошибки на своих экранах. Затем вы можете проверить и исправить эти ошибки «за кулисами», не затрагивая реальных пользователей.
2. Отладка ошибок PHP с помощью плагинов
Хотя описанный выше метод прост, вам необходимо получить доступ к серверу из учетной записи хостинга или удаленно, используя FTP для редактирования wp-config.php. К счастью, вы можете отлаживать ошибки PHP в WordPress, используя различные типы плагинов. Здесь мы обсудим следующие два плагина:
- Плагин отладки WP
- Плагин Query Monitor
Отладка ошибок PHP с помощью плагина отладки WP
В Отладка WP plugin — это бесплатный плагин WordPress, который запускает режим отладки WordPress и позволяет вести журнал ошибок. При активации этот плагин устанавливает константы отладки в wp-config.php и удаляет их при деактивации. При возникновении проблем возникает исключение PHP. Эти константы включают:
define( 'WP_DEBUG'; true );
define( 'WP_DEBUG_LOG'; true );
define( 'SCRIPT_DEBUG'; true );
define( 'SAVEQUERIES'; true );
Когда плагин деактивирован, предпринимаются все усилия для восстановления состояния уже существующих констант. Тем не менее, настройки по умолчанию и все сохраненные настройки восстанавливаются при повторной активации плагина. Плагин также имеет раздел отладки, в котором вы можете настроить константы отладки. Для начала;
- Перейдите в панель управления WordPress и нажмите меню «Инструменты».
- Щелкните подменю «Отладка WP».
- Прокрутите вниз и выберите константы отладки, которые вы хотите применить на своем сайте.
- Нажмите кнопку «Сохранить изменения», чтобы применить изменения, как показано на изображении ниже.

Отладка ошибок PHP с помощью подключаемого модуля Query Monitor
Монитор запросов — это бесплатный плагин WordPress, который помогает веб-администраторам анализировать запросы веб-страниц и веб-страниц. Он также предупредит вас о серьезных ошибках PHP среди множества его применений. Вы увидите новый элемент в верхней панели администратора после его установки и активации. Когда он определяет критическую (PHP) проблему, панель инструментов становится красной, как показано на изображении ниже.

Эта панель инструментов содержит раскрывающееся меню с несколькими параметрами, которые вы можете использовать для управления своим сайтом WordPress. Однако в этом посте мы сосредоточимся только на ошибках PHP. Наведите указатель мыши на недавно появившуюся панель инструментов «Монитор запросов» и щелкните «Ошибки PHP». Откроется окно со всеми ошибками PHP на вашем сайте WordPress, как показано на изображении ниже.

Кроме того, вы можете установить файл cookie аутентификации, который позволяет вам просматривать выходные данные Query Monitor, когда вы не вошли в систему или когда вы вошли в систему как другой пользователь. Для этого выполните следующие действия:
- Перейдите в раздел «Плагины» на панели инструментов WordPress.
- Нажмите на опцию «Настройки» под плагином Query Monitor.
- На вашей панели администратора появится окно консоли разработчика.
- Нажмите «Установить файл cookie для аутентификации».

Заключение
В этом посте представлены различные методы, которые вы можете использовать для отладки ошибок PHP на своем веб-сайте WordPress. Если вы хорошо разбираетесь в программировании, вам обязательно стоит попробовать ручной способ взаимодействия непосредственно с вашим кодом WordPress. Однако будьте осторожны при редактировании файлов и не создавайте больше ошибок. Если вам нужен быстрый и простой подход, плагины вам очень пригодятся.